Overview
Kubernetes events provide critical insight into the state of your cluster resources — Pods, Deployments, Nodes, and more. They help you monitor application and cluster health, detect failures as they happen, and troubleshoot issues after the fact.
With the Kubernetes 2.0 Agent, you can export Kube Events to OpsRamp as:
- Logs — for full audit coverage and historical search
- Alerts — for real-time notification on critical events
- Both — with independent filtering rules for each
Starting with Agent version 22.0.0, you can configure the logs and alerts pipelines completely independently. This means you can, for example:
- Collect all events as logs for complete audit coverage, while alerting only on critical events.
- Send namespace-scoped alerts while keeping broad log collection.
- Apply entirely different filters to each pipeline.
Prerequisites
- The Kube Events option must be enabled during Kubernetes 2.0 Agent installation. See the Agent Installation Guide for details.
- Agent version 22.0.0 or later is required for independent logs/alerts configuration. Earlier versions support only a single shared filter configuration.
- To export events as logs, Log Management must also be enabled at the client level.
Configuration
All Kube Events configuration lives in a single Kubernetes ConfigMap: opsramp-k8s-events-user-config. The agent detects changes to it automatically and applies them within a few minutes. No agent restart is required.
Step 1: Check for the existing ConfigMap
kubectl get configmap opsramp-k8s-events-user-config -n <agent-installed-namespace> -oyaml
Step 2: Open the ConfigMap for editing
kubectl edit cm opsramp-k8s-events-user-config -n <agent-installed-namespace>
This opens the ConfigMap in your default editor.
Step 3: Review the default configuration
apiVersion: v1
kind: ConfigMap
metadata:
  name: opsramp-k8s-events-user-config
  labels:
    app: opsramp-k8s-events
  namespace: opsramp-agent
data:
  eventsConfig.yaml: |
    # There is a universal LOG management setting for all logs.
    # logs_enabled only takes effect if Log Management is enabled at the client level.
    logs_enabled: true
    alerts_enabled: false
    namespaces:
    exclude_namespaces:
    event_types:
    include_involved_objects:
      Pod:
        include_reasons:
        - name: Failed
        - name: InspectFailed
        - name: ErrImageNeverPull
        - name: OutOfDisk
        - name: HostPortConflict
        exclude_reasons:
      Node:
        include_reasons:
        - name: RegisteredNode
        - name: RemovingNode
        - name: DeletingNode
        - name: TerminatingEvictedPod
        - name: NodeNotReady
        - name: NodeSchedulable
        - name: NodeNotSchedulable
        - name: CIDRNotAvailable
        - name: CIDRAssignmentFailed
        - name: KubeletSetupFailed
        - name: FailedMount
        - name: NodeSelectorMismatching
        - name: InsufficientFreeCPU
        - name: InsufficientFreeMemory
        - name: OutOfDisk
        - name: HostNetworkNotSupported
        - name: NilShaper
        - name: Rebooted
        - name: NodeHasSufficientDisk
        - name: NodeOutOfDisk
        - name: InvalidDiskCapacity
        - name: FreeDiskSpaceFailed
        exclude_reasons:
      Other:
        include_reasons:
        - name: FailedBinding
        - name: FailedScheduling
        - name: FailedCreate
        - name: FailedDelete
        exclude_reasons:
    logs_config_override:
    alerts_config_override:
Step 4: Configure the base filters
The following top-level fields apply to both the logs and alerts pipelines by default. If you do not use the override blocks (covered in Step 5), these filters apply uniformly to everything the agent exports.
| Field | Type | Description |
|---|---|---|
logs_enabled | Boolean | Set to true to export Kubernetes events as logs. Log Management must be enabled at the client level. |
alerts_enabled | Boolean | Set to true to export Kubernetes events as alerts. |
namespaces | List of strings | Restricts event collection to the specified namespaces. Leave empty to collect events from all namespaces. |
exclude_namespaces | List of strings | Excludes the specified namespaces from event collection. Leave empty to exclude no namespaces. Can be used together with namespaces. |
event_types | List of strings | Filters events by type. Supported values are Normal and Warning. Leave empty to collect all event types. |
include_involved_objects | Map | Filters events by Kubernetes object kind and event reason. Leave empty to collect events for all object kinds. |
a. Namespace filtering
By default, events from all namespaces are exported. To restrict collection to specific namespaces:
namespaces: ["default", "agent-namespace", "kube-system"]
b. Namespace exclusion filtering
Rather than listing every namespace you want, you can instead list only the ones to exclude:
exclude_namespaces: ["kube-system", "cert-manager", "monitoring"]
namespaces and exclude_namespaces compose together:
namespaces | exclude_namespaces | Effective Namespace Set |
|---|---|---|
| Empty | Empty | All namespaces. |
[prod, staging] | Empty | Only {prod, staging} are included. |
| Empty | [kube-system] | All namespaces are included except {kube-system}. |
[prod, staging, kube-system] | [kube-system] | {prod, staging} after applying the exclusion set difference. |
Both fields use exact string matching only; no regex or glob patterns.
c. Event type filtering
Kubernetes supports two event types: Normal, Warning. Restrict collection with:
event_types: ["Warning"]
d. Object and reason filtering
Use include_involved_objects to filter by object kind (Pod, Node, or Other) and specific event reasons within each kind. You can also attach a severity attribute to a reason, which controls the severity level of any resulting alert.
include_involved_objects:
  Pod:
    include_reasons:
    - name: Failed
    - name: InspectFailed
    - name: ErrImageNeverPull
    - name: OutOfDisk
    - name: HostPortConflict
      attributes:
        - key: severity
          value: Warning
If
include_involved_objectsis left empty, all events from all object kinds are captured.
Use the Other kind to capture event reasons that are not tied to a specific object type:
Other:
  include_reasons:
  - name: FailedBinding
  - name: FailedScheduling
  - name: SuccessfulCreate
  - name: FailedCreate
  - name: SuccessfulDelete
  - name: FailedDelete
e. Reason exclusion filtering
The standard include_reasons field works as an allowlist, meaning any new event reason introduced by a Kubernetes upgrade or custom controller is silently dropped unless you add it manually. The exclude_reasons field inverts this: you list only the known-noisy reasons to drop, and everything else, including future reasons, is collected automatically.
include_involved_objects:
  Pod:
    include_reasons:
    - name: Failed
    - name: BackOff
    exclude_reasons: []
  Node:
    exclude_reasons:
    - name: NodeHasSufficientMemory
    - name: NodeHasSufficientDisk
    - name: NodeHasNoDiskPressure
  Other:
    include_reasons:
    - name: FailedBinding
    - name: FailedScheduling
    exclude_reasons: []
In this example: Pod events are collected only for Failed and BackOff (include-based). Node events are collected for everything except the three listed noisy reasons (exclude-based). Other events are collected only for the two listed reasons.
How include_reasons and exclude_reasons interact, per kind:
include_reasons | exclude_reasons | Behavior |
|---|---|---|
| Absent or empty | Absent or empty | All event reasons for the selected Kubernetes object kind are collected. |
| Set | Absent or empty | Only the specified event reasons are collected. |
| Absent or empty | Set | All event reasons are collected except those listed in exclude_reasons. |
| Set | Set | Only the event reasons listed in include_reasons are collected, excluding any that also appear in exclude_reasons. If the same reason exists in both lists, exclude_reasons takes precedence. |
If an event’s kind isn’t explicitly configured in
include_involved_objects, theOther.exclude_reasonslist applies as a fallback.
Step 5: Configure independent logs and alerts filtering (optional)
If your logs and alerts pipelines need different filtering — for example, broad log collection but narrow, high-signal alerting — use the logs_config_override and alerts_config_override blocks. Each supports the same filter keys as the base config: namespaces, exclude_namespaces, event_types, include_involved_objects.
logs_config_override:
  namespaces: ["staging", "production"]
  event_types: ["Normal", "Warning"]

alerts_config_override:
  namespaces: ["production"]
  event_types: ["Warning"]
How override resolution works
| Condition | Logs Pipeline Uses | Alerts Pipeline Uses |
|---|---|---|
| Neither override is defined. | Base configuration. | Base configuration. |
Only logs_config_override defines filter keys. | logs_config_override | Base configuration. |
Only alerts_config_override defines filter keys. | Base configuration. | alerts_config_override |
| Both overrides define filter keys. | logs_config_override | alerts_config_override |
Configuration scenarios
| # | Scenario | logs_config_override | alerts_config_override | Behavior |
|---|---|---|---|---|
| 1 | Default / Backward Compatible | Empty | Empty | Both pipelines use the base configuration. This behavior is identical to releases prior to 22.0.0. |
| 2 | Broad Logs, Narrow Alerts | Empty | Contains filter keys | The logs pipeline uses the base configuration (broad scope), while the alerts pipeline uses the override configuration (narrow scope). |
| 3 | Narrow Logs, Broad Alerts | Contains filter keys | Empty | The logs pipeline uses the override configuration (narrow scope), while the alerts pipeline uses the base configuration (broad scope). |
| 4 | Fully Independent | Contains filter keys | Contains filter keys | Each pipeline uses its own override configuration. Log and alert filtering are completely independent. |
| 5 | Logs Only | — | — | Setting alerts_enabled: false disables alert generation regardless of any alert override configuration. |
| 6 | Alerts Only | — | — | Setting logs_enabled: false, or disabling Log Management at the client level, prevents log collection regardless of any log override configuration. |
Caution
Important rules:
- An override block only activates once it contains at least one recognized filter key (
namespaces,exclude_namespaces,event_types, orinclude_involved_objects). An empty override (logs_config_override:with nothing under it) is treated as absent, and the base config applies instead. - Within an active override block, any field you specify replaces the base value for that field only. Fields you do not specify in the override are treated as empty (meaning: collect all), and they do not inherit the base config’s value for that field.
logs_enabledandalerts_enabledcontrol whether each pipeline runs at all. Override blocks only control what is filtered, and they cannot turn a disabled pipeline back on.
Step 6: Save and apply
Save and close the editor. The agent detects the change automatically and applies it within a few minutes. No restart is required.
Examples
Example 1: Broad logs, narrow alerts
Collect all events as logs, but only alert on Warning-level events in production.
logs_enabled: true
alerts_enabled: true
namespaces:
exclude_namespaces:
event_types:
include_involved_objects:
  Pod:
    include_reasons:
    - name: Failed
    exclude_reasons:
  # ...full list as in the default config above
logs_config_override:
alerts_config_override:
  namespaces: ["production"]
  event_types: ["Warning"]
  include_involved_objects:
    Pod:
      include_reasons:
      - name: Failed
        attributes:
          - key: severity
            value: Critical
      - name: BackOff
        attributes:
          - key: severity
            value: Warning
Result: Logs pipeline uses the base config, collects events from all namespaces and all included reasons. Alerts pipeline uses alerts_config_override — only Failed and BackOff events from production, tagged with severity.
Example 2: Namespace-scoped alerts, broader log collection
logs_enabled: true
alerts_enabled: true
namespaces: ["default", "kube-system", "monitoring"]
event_types:
include_involved_objects:
  Pod:
    include_reasons:
    - name: Failed
    exclude_reasons:
  # ...full list as in the default config above
logs_config_override:
alerts_config_override:
  namespaces: ["monitoring"]
  include_involved_objects:
    Pod:
      include_reasons:
      - name: Failed
        attributes:
          - key: severity
            value: Critical
Result: Logs pipeline uses the base config, collects from default, kube-system, and monitoring. Alerts pipeline uses the override — only Failed Pod events from monitoring.
Example 3: Fully independent configuration
logs_enabled: true
alerts_enabled: true
namespaces:
event_types:
include_involved_objects:
  Pod:
    include_reasons:
    - name: Failed
    exclude_reasons:
  # ...full list as in the default config above
logs_config_override:
  namespaces: ["staging", "production"]
  event_types: ["Normal", "Warning"]
alerts_config_override:
  namespaces: ["production"]
  event_types: ["Warning"]
  include_involved_objects:
    Pod:
      include_reasons:
      - name: Failed
        attributes:
          - key: severity
            value: Critical
    Node:
      include_reasons:
      - name: NodeNotReady
        attributes:
          - key: severity
            value: Warning
Result: Logs pipeline uses logs_config_override — all Normal and Warning events from staging and production (since include_involved_objects isn’t set in the override, all reasons from all kinds are collected). Alerts pipeline uses alerts_config_override — only Warning-severity Failed Pod events and NodeNotReady events, from production only.
Example 4: Exclude noisy namespaces from alerts only
logs_enabled: true
alerts_enabled: true
namespaces:
exclude_namespaces:
event_types:
include_involved_objects:
  Pod:
    include_reasons:
    - name: Failed
    - name: BackOff
logs_config_override:
alerts_config_override:
  exclude_namespaces: ["kube-system", "monitoring"]
Result: Logs pipeline uses the base config, collects Failed and BackOff events from all namespaces. Alerts pipeline uses the override and collects all events from all namespaces except kube-system and monitoring.
Example 5: Exclude noisy reasons from Node events
logs_enabled: true
alerts_enabled: true
namespaces:
exclude_namespaces:
event_types:
include_involved_objects:
  Pod:
    include_reasons:
    - name: Failed
    - name: BackOff
  Node:
    exclude_reasons:
    - name: NodeHasSufficientMemory
    - name: NodeHasSufficientDisk
    - name: NodeHasNoDiskPressure
  Other:
    include_reasons:
    - name: FailedScheduling
    - name: FailedBinding
logs_config_override:
alerts_config_override:
Result: All Node events are collected except the three noisy informational reasons. Pod and Other events are filtered by include_reasons as usual.
View events in the OpsRamp console
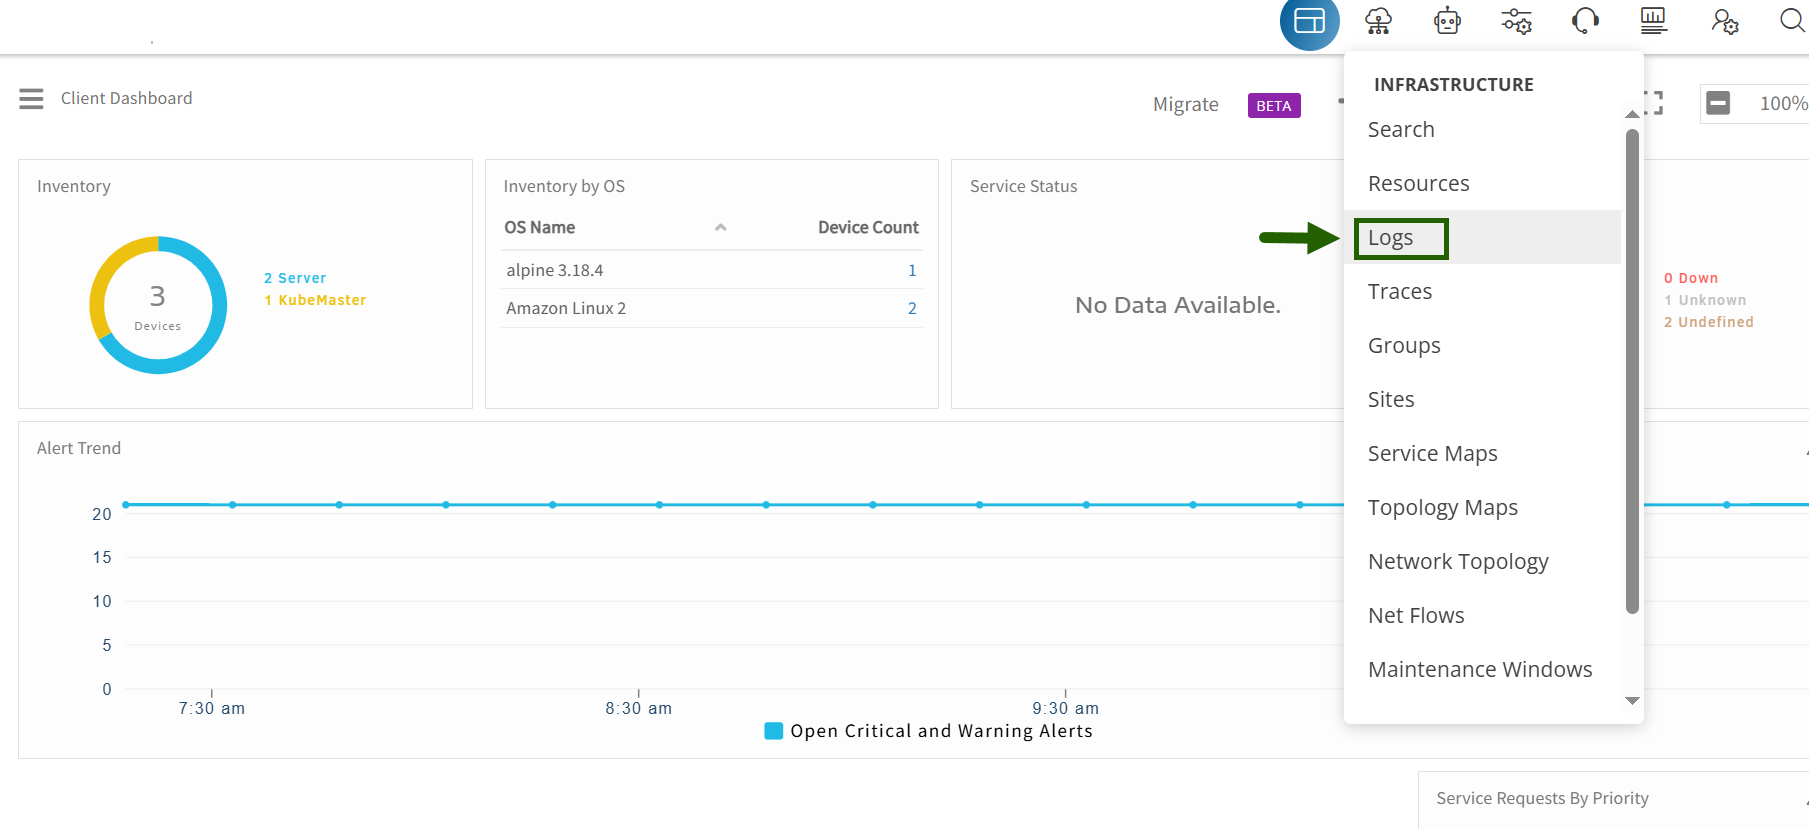
- Navigate to Infrastructure > Logs in the OpsRamp console.
- The Default Logs screen appears.
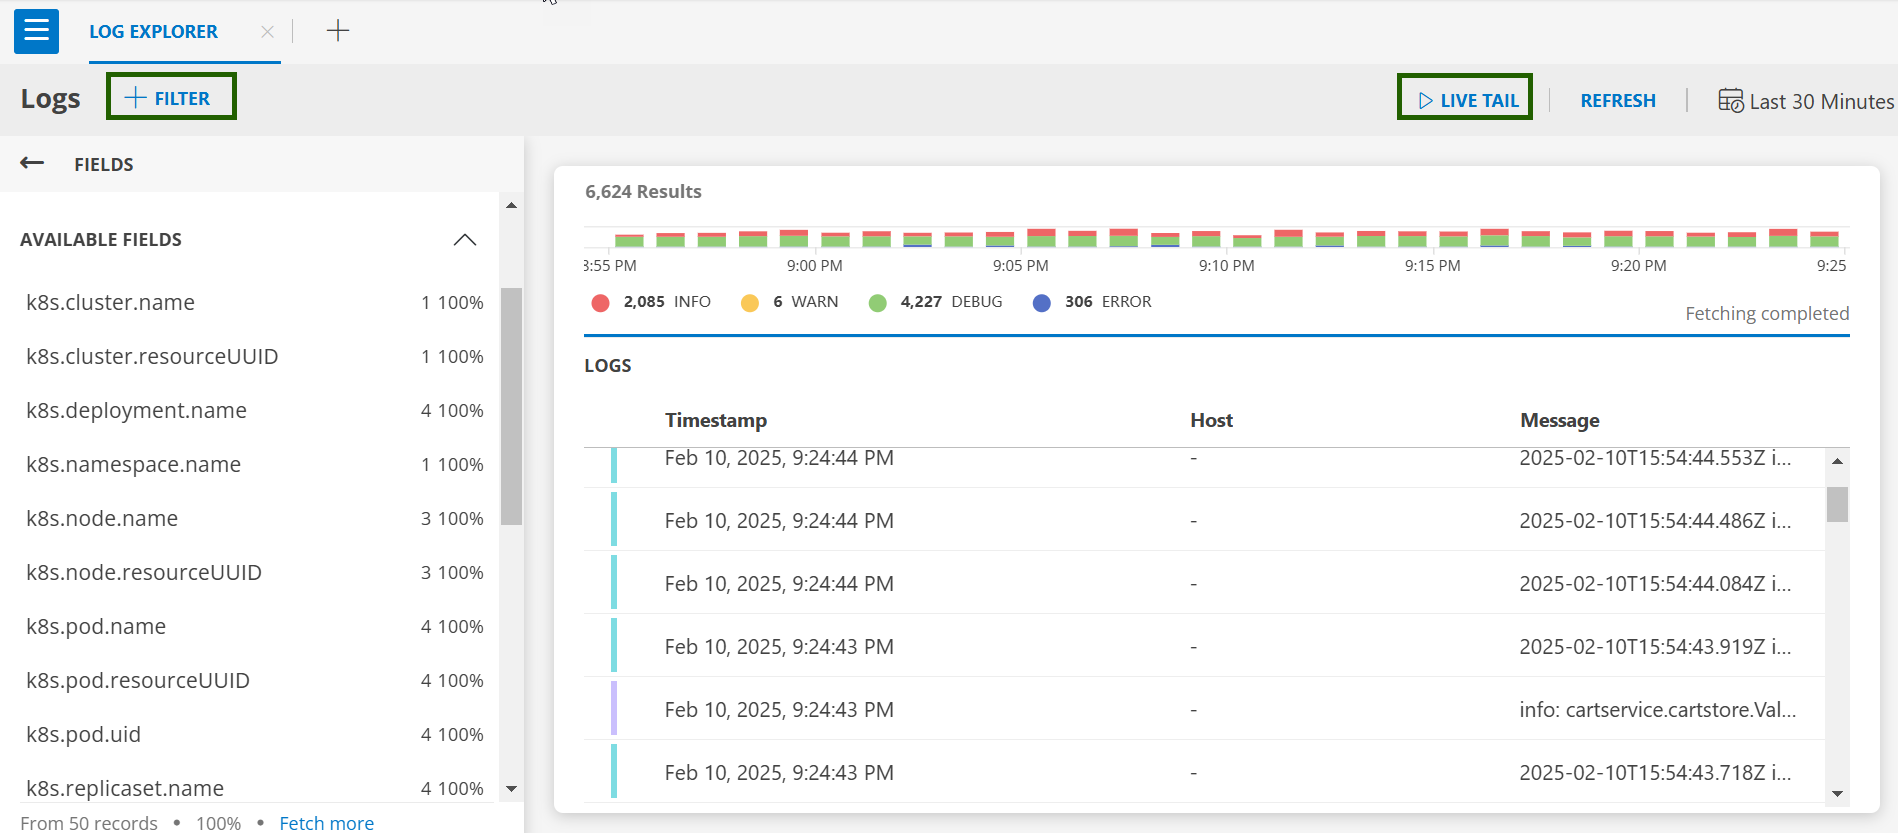
- Click on +FILTER and search for
type = eventsto see the list of events.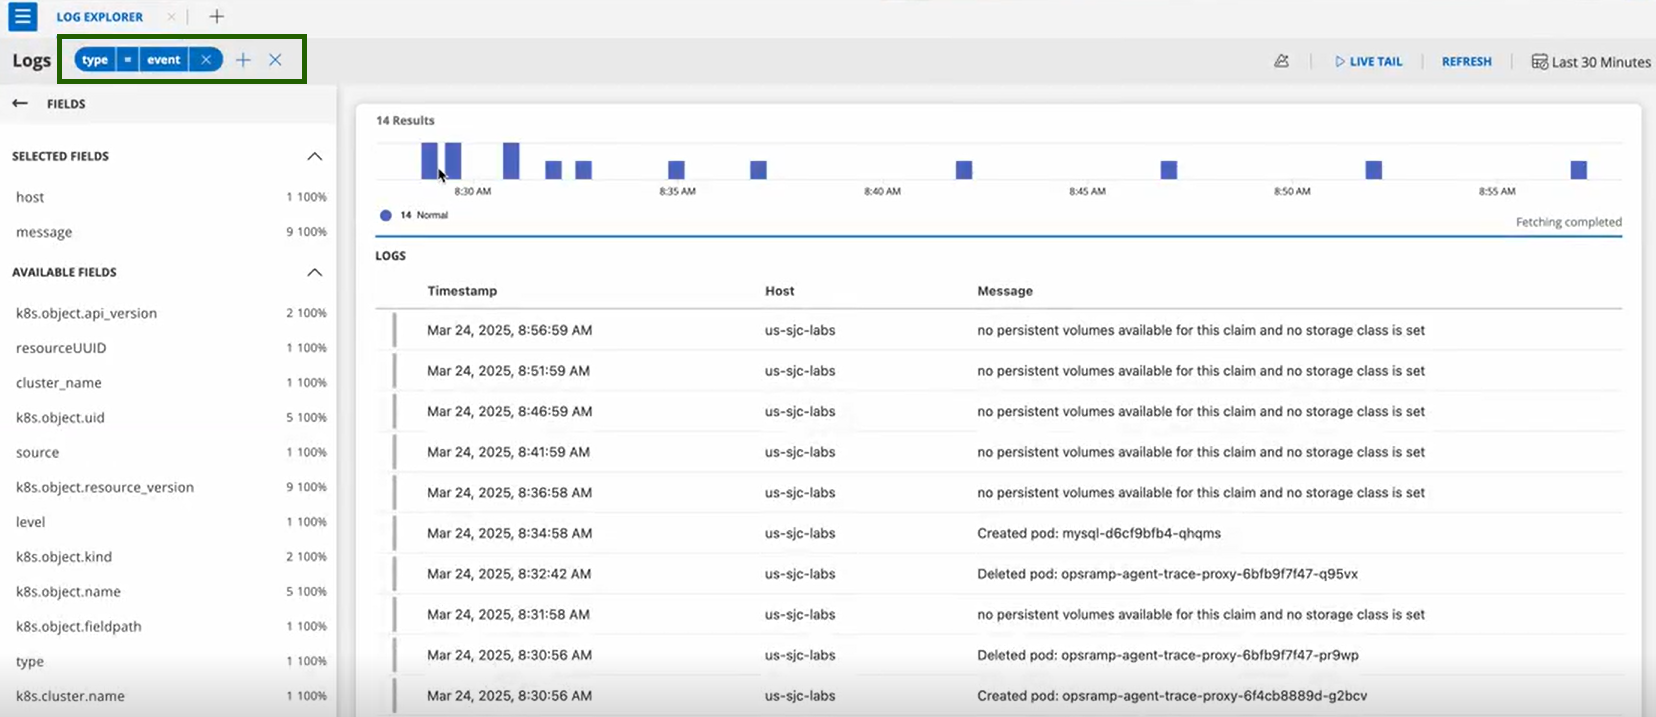
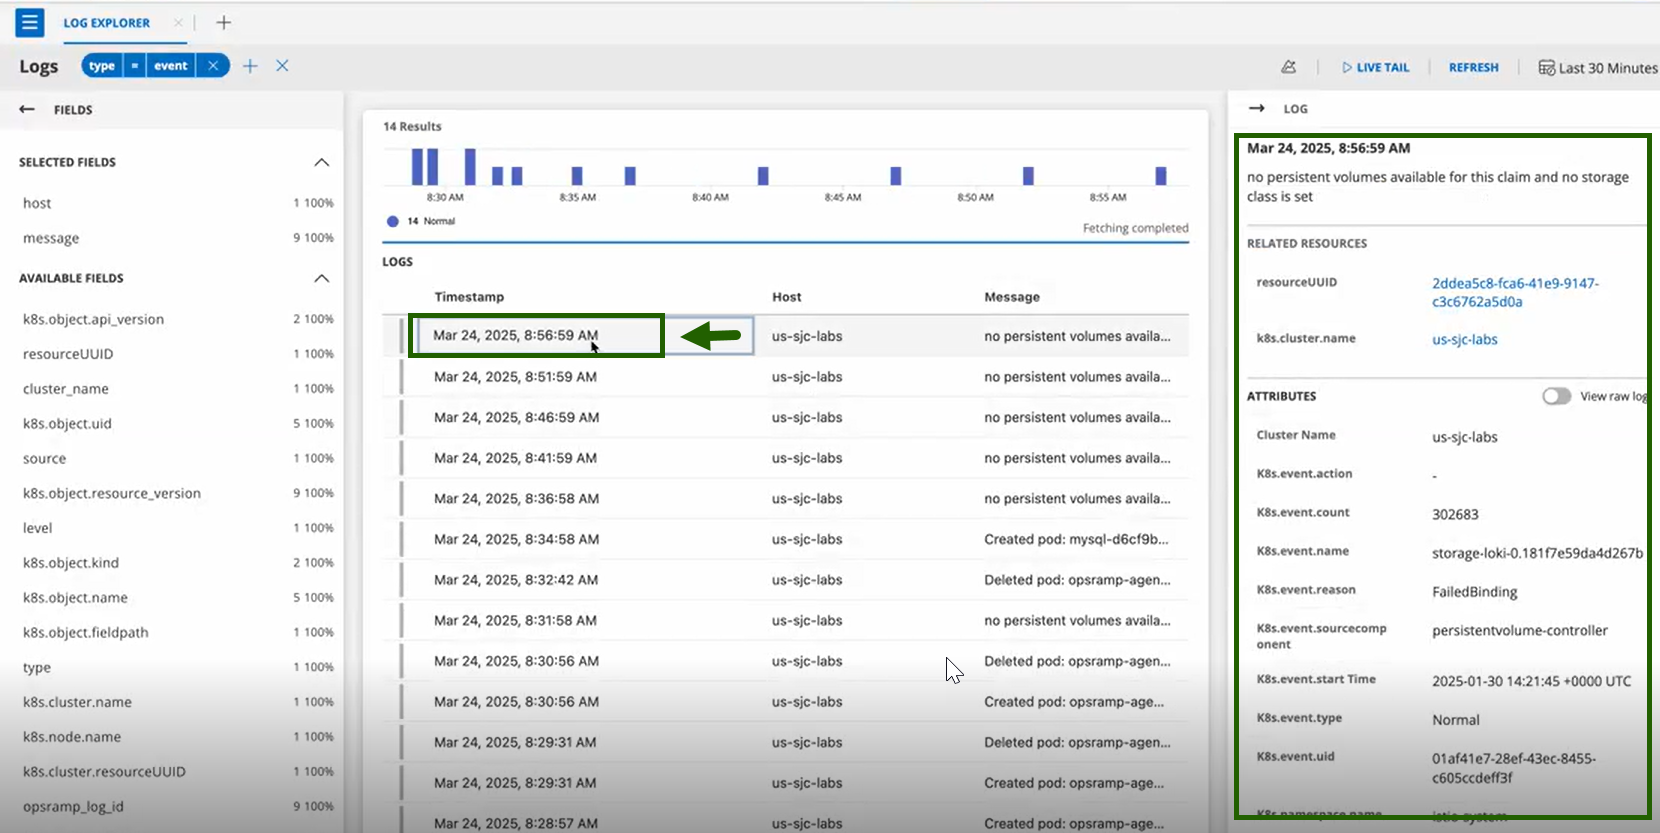
- Click on any event entry for detailed information.
Once you edit the Kubernetes ConfigMap and apply it to your cluster, the OpsRamp Kubernetes 2.0 Agent picks up the latest configuration changes within a few minutes.
Key points to note
- In the log listing UI, the Host column will be empty. Instead, a Resource Name column is displayed, showing the name of the Kubernetes resource associated with the event, for example, the Pod name if the event pertains to a Pod.
- Kubernetes events are now automatically linked to the corresponding resource in OpsRamp. If the resource does not exist, the event links to the cluster.
- Field differences between Kubernetes 1.0 and 2.0:
- Kubernetes 1.0: The Resource field displays either the IntegrationName or KubeMaster.
- Kubernetes 2.0: The Resource field shows the name of the object that triggered the event as much as possible.
Example: For a Pod Killing event, the Resource shows the Pod name if the Pod’s resourceUUID is available. If not, it falls back to displaying the cluster name. 4. The metric name changed from KubeEvents to kubernetes_events. 5. The component format changed to objectUuid - eventReason. 6. Some additional attributes have been added based on the event type. 7. Alerts do not auto-heal. You must manually suppress or resolve them.
Troubleshooting
If you encounter kube events issues, see the Troubleshooting documentation.