The Network Performance Management (NPM) guide is designed to help you navigate and utilize the features of our dashboard efficiently.
Introduction
The NPM Dashboard provides a comprehensive view of network performance metrics collected and analyzed by OpsRamp’s Network Performance Monitoring capabilities. The NPM utilizes flow technologies (sFlow, NetFlow v5/9, and IPFIX) to gain insight into network performance providing end-to-end visibility. With the ability to drill down to network hotspots, NPM enables Network Administrators to handle network-based performance issues and plan for capacity updates proactively.
The NetFlow conversation typically refers to communicating or exchanging data packets between network devices or endpoints. This analysis provides insights into network traffic, including source and destination IP addresses, ports used, the volume of data exchanged, and DSCP (Differentiated Services Code Point) markings for Quality of Service (QoS) classification and traffic prioritization.
NPM depends on a Flow Collector Integration to be installed and provides out-of-the-box dashboards for Top Talkers with respect to the Conversations, Protocols, DSCP values, etc. The DSCP support enables administrators to monitor and analyze traffic based on service classes, helping identify performance issues related to specific traffic types and ensuring optimal network resource allocation for critical applications.
Key components of NPM are:Flow exporter: A network device (usually a router or firewall) collects and exports flow information to a flow collector.Flow collector application: An appliance or server that receives exported flow information.Flow ingester: An internal OpsRamp cloud component that analyzes flow information collected by the flow collector; no customer action is required.
Prerequisites
- NextGen Gateway version 17.2.0 or above is required (Classic Gateway is not supported).
- Enable third-party integration during gateway installation using the
-t enableflag:
Opsramp-collector-start install --environment k8s --url {OpsRamp Server URL} --key {Gateway unique authentication token} -t enable -V 17.2.0
- Contact OpsRamp Support to enable the NPM feature at the Partner or Client level.
- Configure SNMP Discovery on network devices to retrieve device and interface details.
- For Viptela (Cisco SD-WAN) interfaces, SDK-based discovery is supported from SDK App version 3.0.0.
- Resources are network devices such as routers, switches, and firewalls that export flow data to the NPM collector. Only resources that are in a Managed state in OpsRamp and explicitly whitelisted are authorized to function as flow exporters and send flow data to the collector.
- Network devices must be configured to export flow data using a supported protocol:
- sFlow (port 6343)
- NetFlow v5 (port 9996)
- NetFlow v9 (port 4729)
- IPFIX (port 4739)
- Ensure collector ports are reachable from network devices (recommended NodePort range: 30100-32000).
Install NPM Collector
See NPM Collector for more details.
Note
During NPM collector installation, it is recommended to use the NodePort range 30100-32000. Otherwise, the Kubernetes cluster configuration must be updated to accept a different range.
Protocol defaults used by NPM are:
- sFlow: UDP 6343
- NetFlow v5: UDP 9996
- NetFlow v9: UDP 4729
- IPFIX: UDP 4739
After installation, verify the exact NodePort mappings configured in your cluster:
kubectl get svc -n <namespace> | grep npm-collector
Enable NPM
See Users and Permissions for more details on how to enable Network Performance Management from the OpsRamp portal.
Note
To enable NPM, you need theDevice_View, NPM_View or NPM_Manage permissions.NPM Dashboard
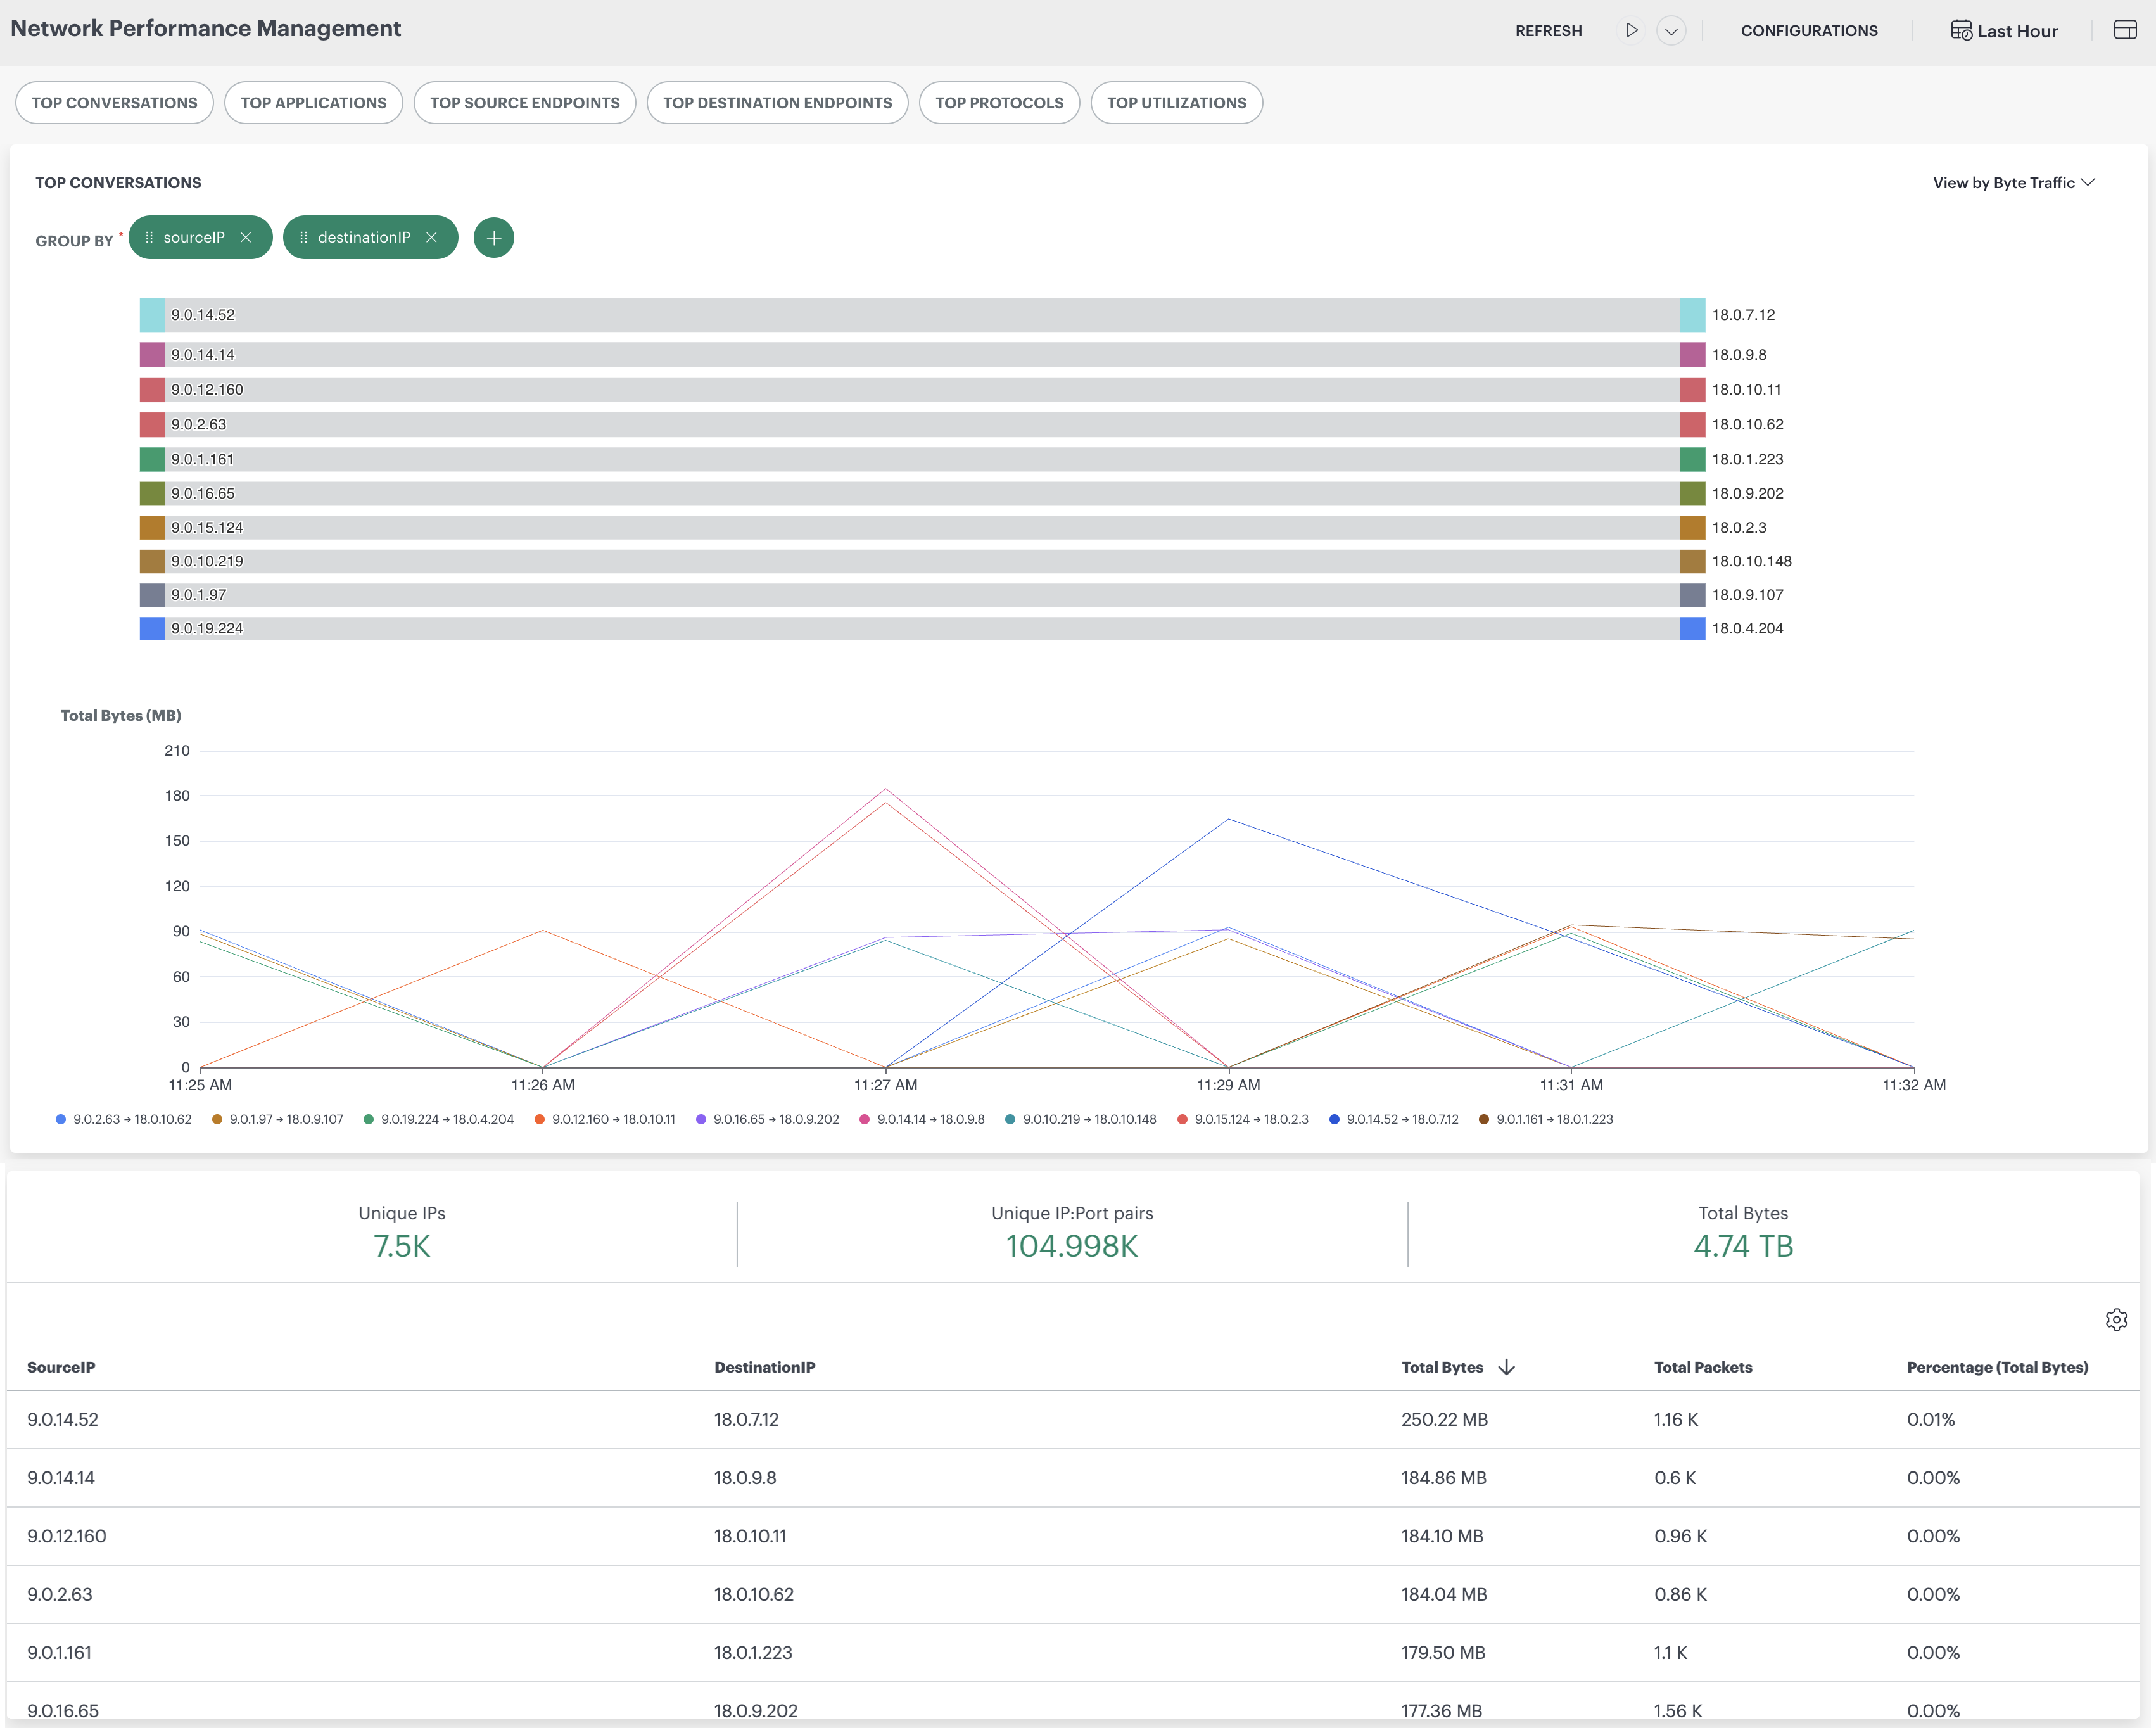
The Network Performance Management is your home base where you can view the information regarding flow records generated by network devices. The dashboard provides insights into your network’s performance through various metrics and visualizations. You can view a visual representation of the flow records, including top conversations, applications, source endpoints, destination endpoints, protocols, and DSCP (Differentiated Services Code Point) classifications. The DSCP metrics enable you to monitor Quality of Service (QoS) performance, analyze traffic prioritization patterns, and identify potential service-level issues across different traffic classes.
Navigate to Infrastructure > Net Flows to access the NPM dashboard.
Click on any component within the dashboard interface to activate a dropdown menu, from which you can select other components to interact with.

Dashboard Components
Refers to a section or visualization that displays information about the most active communication exchanges (conversations) occurring within a pair of network endpoints (source and destination).

Refers to a section or visualization that provides insights into the applications or services consuming the most network resources within the monitored environment. These applications could include business-critical applications, web services, file-sharing applications, streaming services, and more.

Identifies the network devices generating the most outbound traffic within the network. These endpoints could include computers, servers, or other devices that initiate communication with other devices or services.

Identifies the network devices receiving the most inbound traffic within the network. These endpoints could include servers, routers, gateways, or any other devices that are the intended recipients of communication from different devices.

Identifies the protocols that are most used for communication within the network. Protocols govern how data is transmitted, received, and interpreted across the network infrastructure.

The Top Utilizations view provides a quick glance at the most utilized network resources and their performance status. This dashboard helps you to monitor high-traffic interfaces, CPU and memory loads, and identify potential issues such as errors or discards on network devices.
Note
The Top Utilizations data is generated from SNMP metrics gathered from your network devices and does not rely on flow data.
Key Features of Top Utilizations
- Network Resource Type: Visual pie chart showing the distribution of resources based on their OS.
- Network Hardware Status: Pie chart indicating the status of hardware.
- Resource by Percentage Memory Use: Displays devices sorted by their memory usage percentage.
- Resource by Average CPU Load: Highlights devices with the highest CPU utilization.
- Interface by Traffic: A table showing top interfaces by network traffic.
- Errors and Discards Section: Displays resources and interfaces experiencing packet errors or discards.
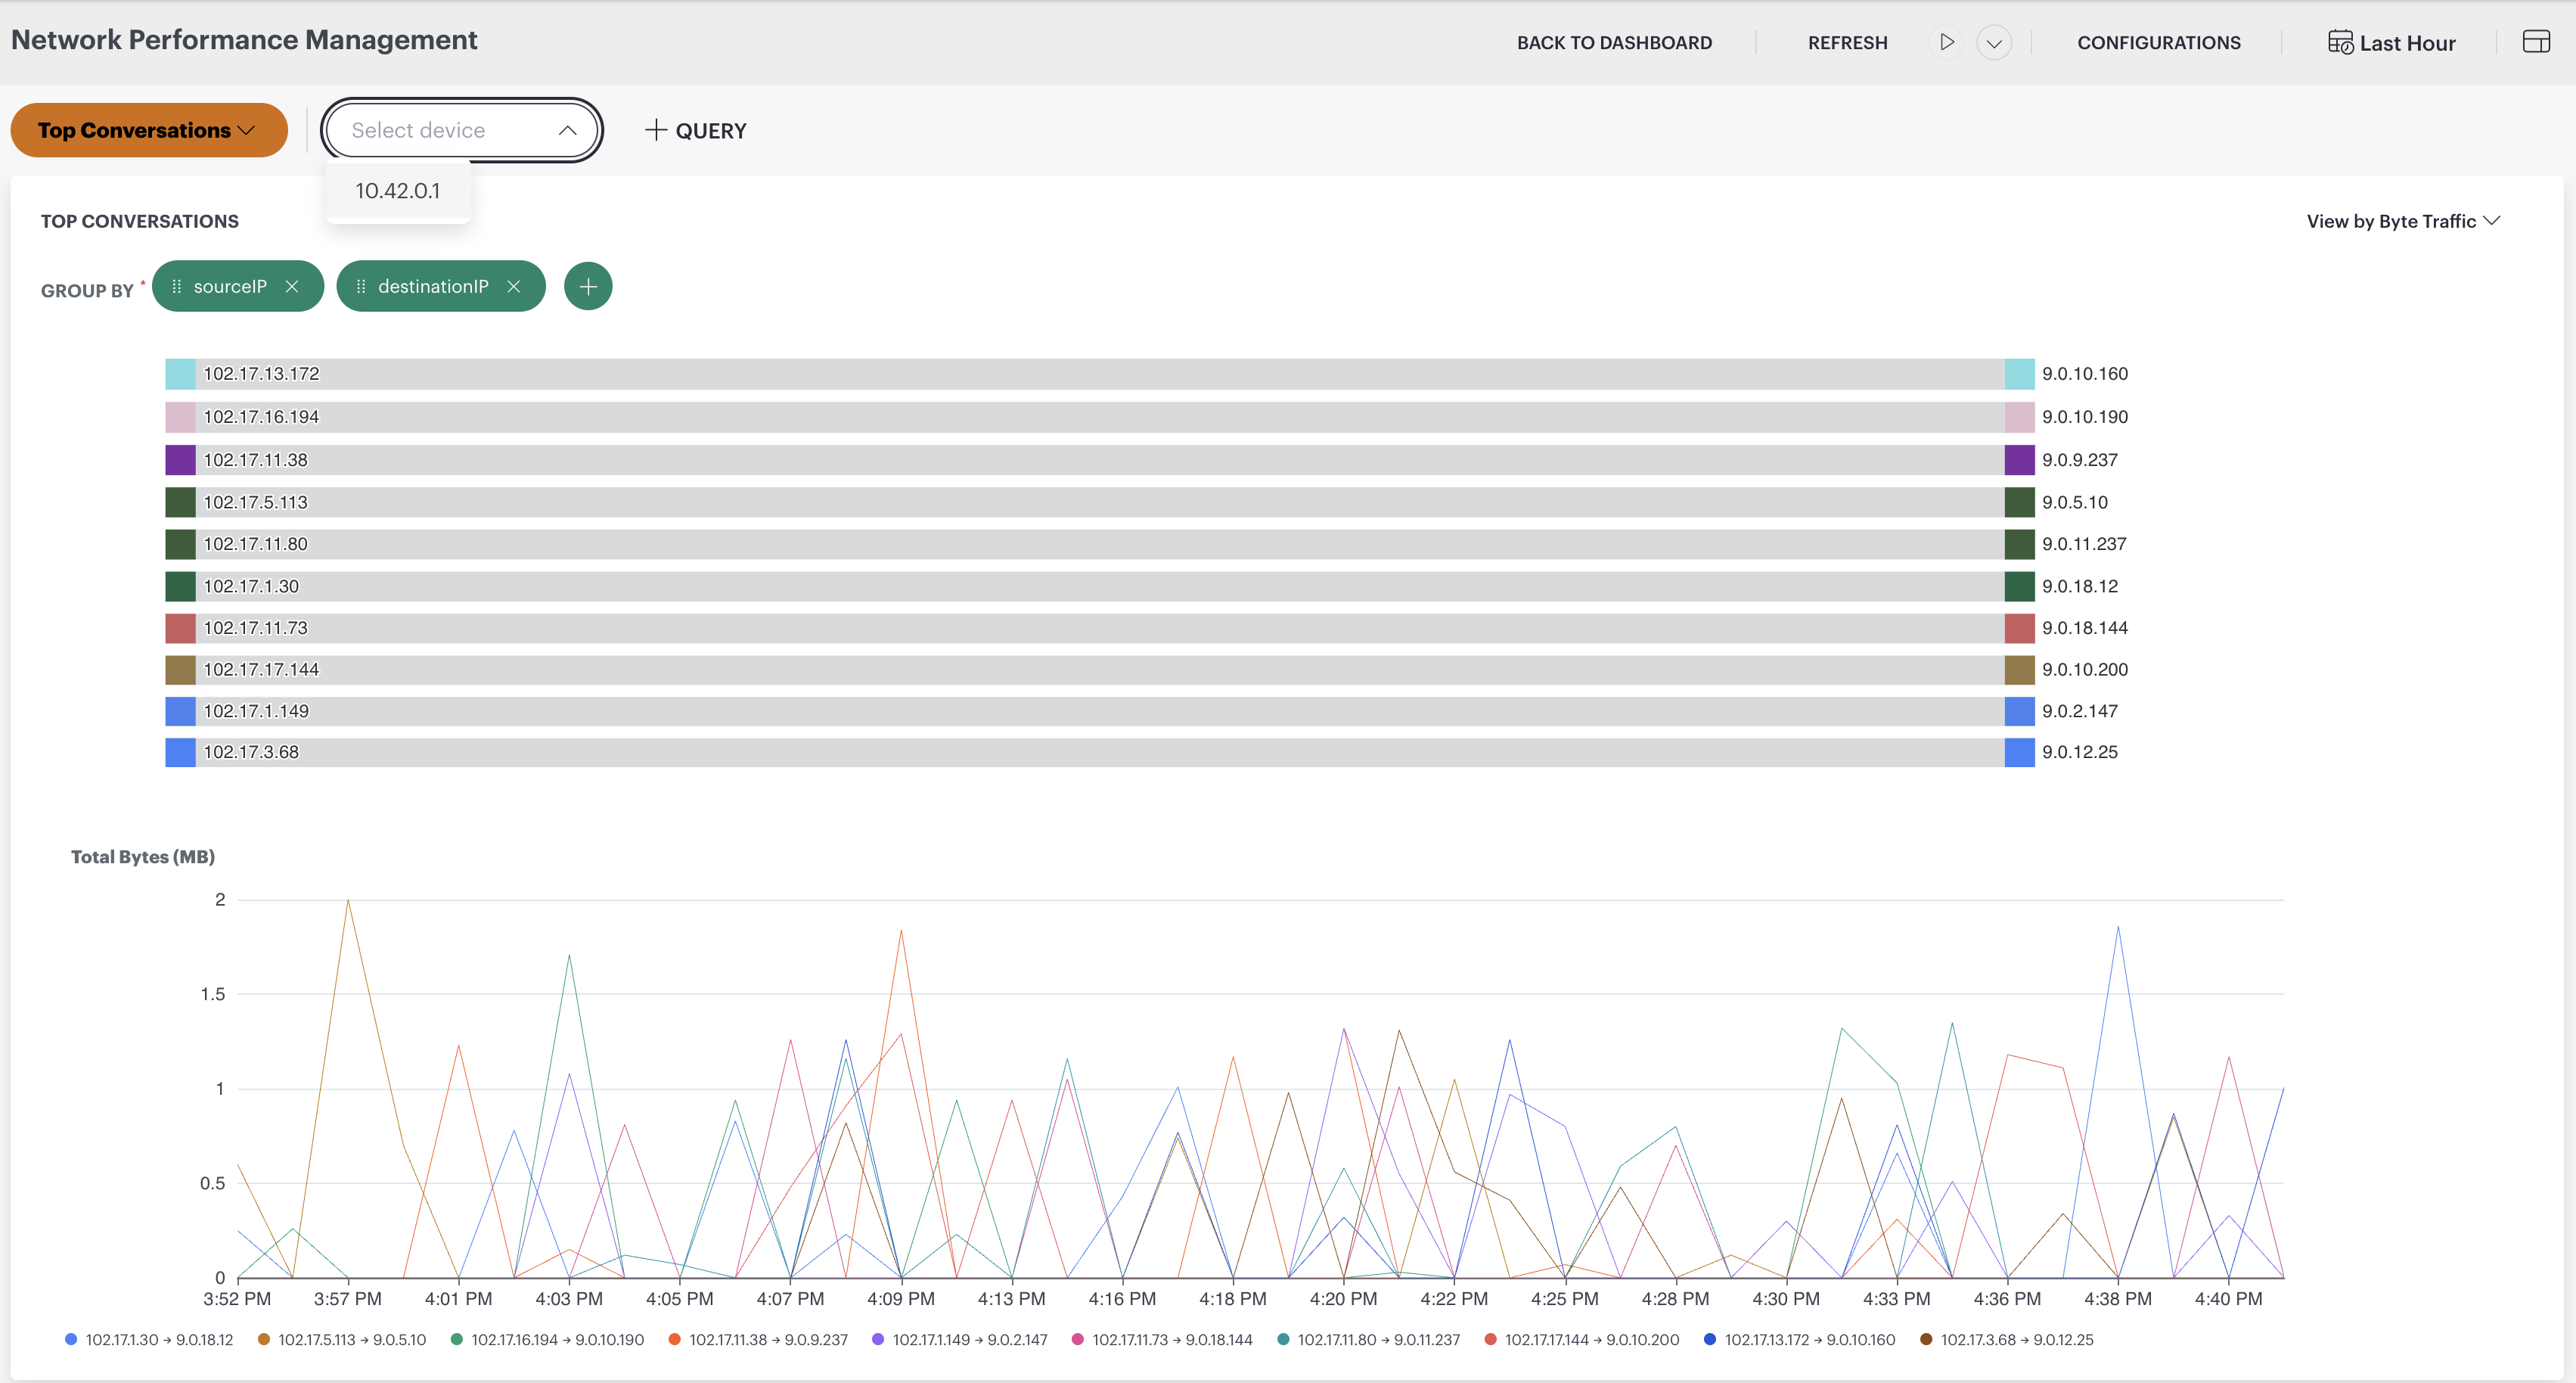
The Select Device, Select Interface, Ingress, and Egress options allow you to specify the network device, interface, and direction of traffic flow for monitoring and analysis purposes.
- Select Device: Lists the network devices (exporters) that have actively sent flow data within the selected time range. Only devices with reported data during the chosen period are displayed.
- Select Interface: Lists the interfaces associated with the selected device that have flow data available.
- Ingress: Traffic entering the selected interface.
- Egress: Traffic leaving the selected interface.
- DSCP: QoS classification field in the IP header (for example, EF for voice, AF41 for video, and CS0 as default best-effort).

The View by Byte Traffic and View by Packet Traffic dropdown options provide you with the ability to choose how you want to view and analyze network traffic data. These dropdown options allow you to toggle between viewing network traffic metrics either by the total number of bytes transferred or by the total number of packets transmitted.
View by Bytes traffic
View by Packet traffic

Graphs
- Sankey Graph: Displays the flow of data between different nodes in your network. Selecting any of the top metrics will generate a Sankey graph illustrating the data flow.
- Time Series Graph: Provides a visual representation of the selected metric over time. This graph allows you to track changes and trends in network performance.
Note
You can use hide or unhide option to hide specific conversations. This feature allows for better focus on the remaining trend graph metrics.
Query
The Query option allows you to specify criteria to filter the data displayed on the NetFlow dashboard. You can filter by time range, applications, protocols, endpoints, DSCP values, or any custom field defined in your NetFlow v9 or IPFIX template.
In addition to the standard 5-tuple attributes (source IP, destination IP, source port, destination port, and protocol), you can now filter using any general field supported by IANA, such as flowDirection, classId, samplerId, and other attributes defined in your custom template.
DSCP values are displayed using standard notations such as EF (Expedited Forwarding), AF (Assured Forwarding) classes like AF11, AF21, AF31, and CS (Class Selector) values like CS0, CS1, and CS2, along with other QoS markings.
Click the arrows to enter a default query to filter the data displayed on the dashboard.

Query Syntax and Operators
Use the following operators in query filters:
- Equals (
=): Matches records where the field value is equal to the specified value. - Not equals (
!=): Matches records where the field value is not equal to the specified value. - IN (
IN): Matches records where the field value is one of the specified values.
Use logical operators to combine conditions:
- AND: Returns records that satisfy all conditions.
- OR: Returns records that satisfy at least one condition.
Example queries:
protocol = "TCP" AND dscp = "EF"sourceIP IN ("10.10.1.5", "10.10.1.6") OR destinationIP = "172.16.2.20"destPort != 53 AND protocol = "UDP"
Custom attribute ENUM mappings can be added based on customer requests. You can contact our Customer Support team to define additional fields, which will be added as needed.
Note
This change is applicable from NPM Collector version 3.0.0.Group By
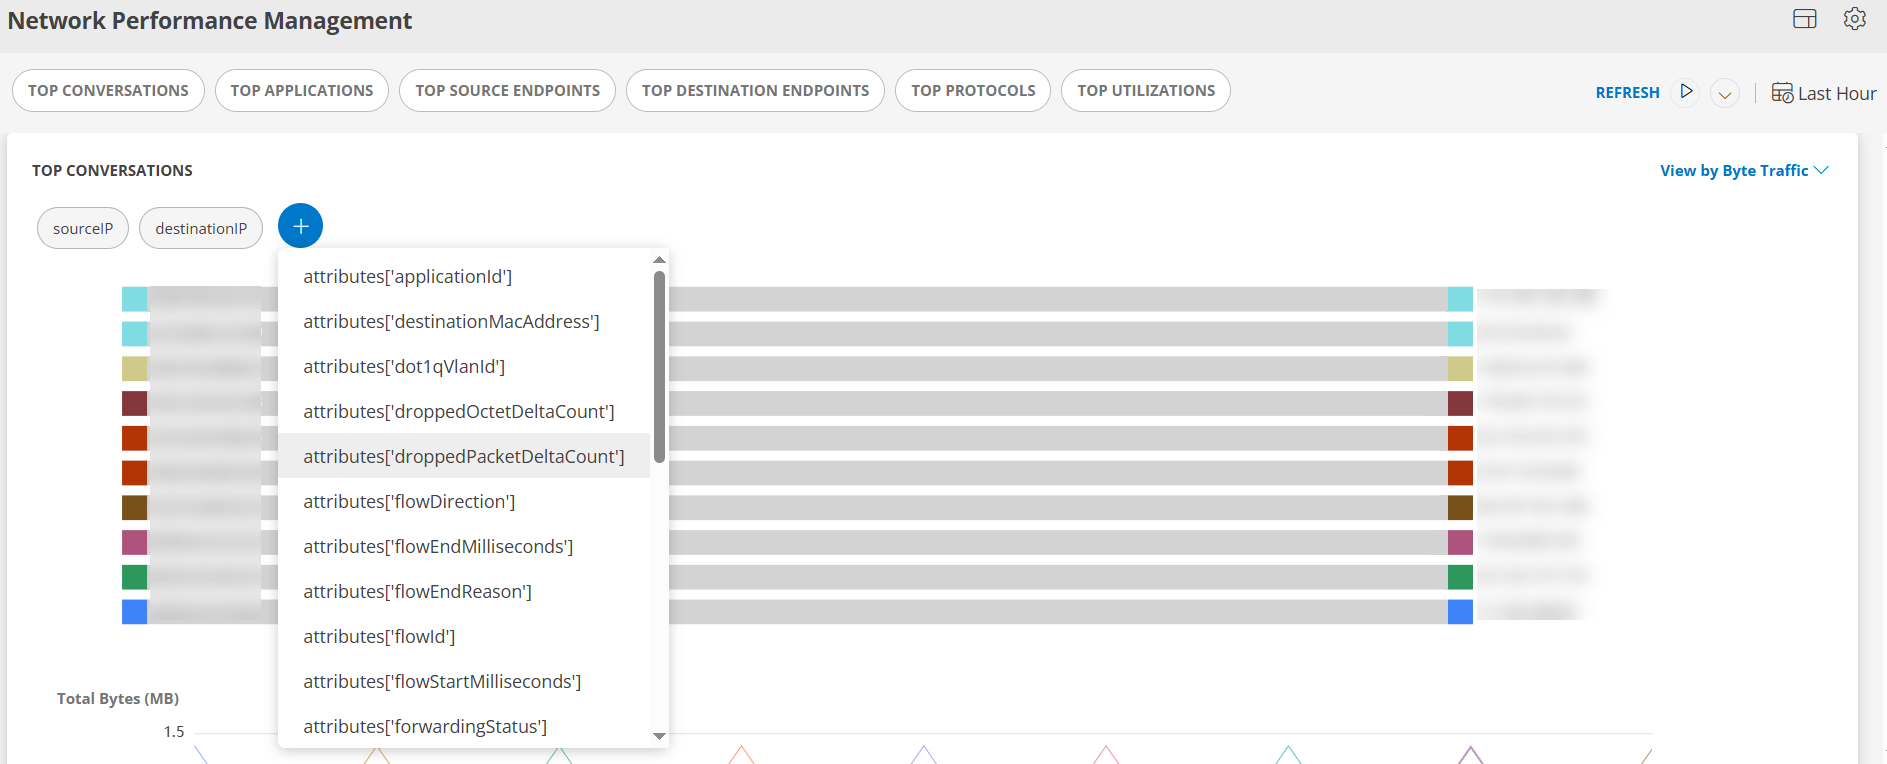
The Group By option allows you to organize NetFlow data based on various parameters such as application, protocol, endpoint, DSCP, or any custom field defined in your NetFlow v9 or IPFIX template.
You can group data using predefined or IANA-defined fields such as flowDirection, flowType, or samplerId, enabling a more granular and customizable view of network traffic.
When grouping by DSCP, the data is organized using standard notations like EF (Expedited Forwarding) for real-time traffic, AF (Assured Forwarding) classes (for example, AF11, AF12), and CS (Class Selector) values such as CS0 (Best Effort), CS1, CS2, and others that categorize traffic based on Quality of Service (QoS) requirements.
Common GROUP BY fields include:
- destDns: Destination DNS hostname.
- destPort: Destination port number.
- dscp: DSCP QoS classification value.
- flowType: Type of flow (Ingress or Egress).
- protocol: Network protocol (for example, TCP, UDP, ICMP).
- srcDns: Source DNS hostname.
- srcPort: Source port number.
- tcpFlags: TCP flags (for example, SYN, ACK, FIN, RST).
Other Components
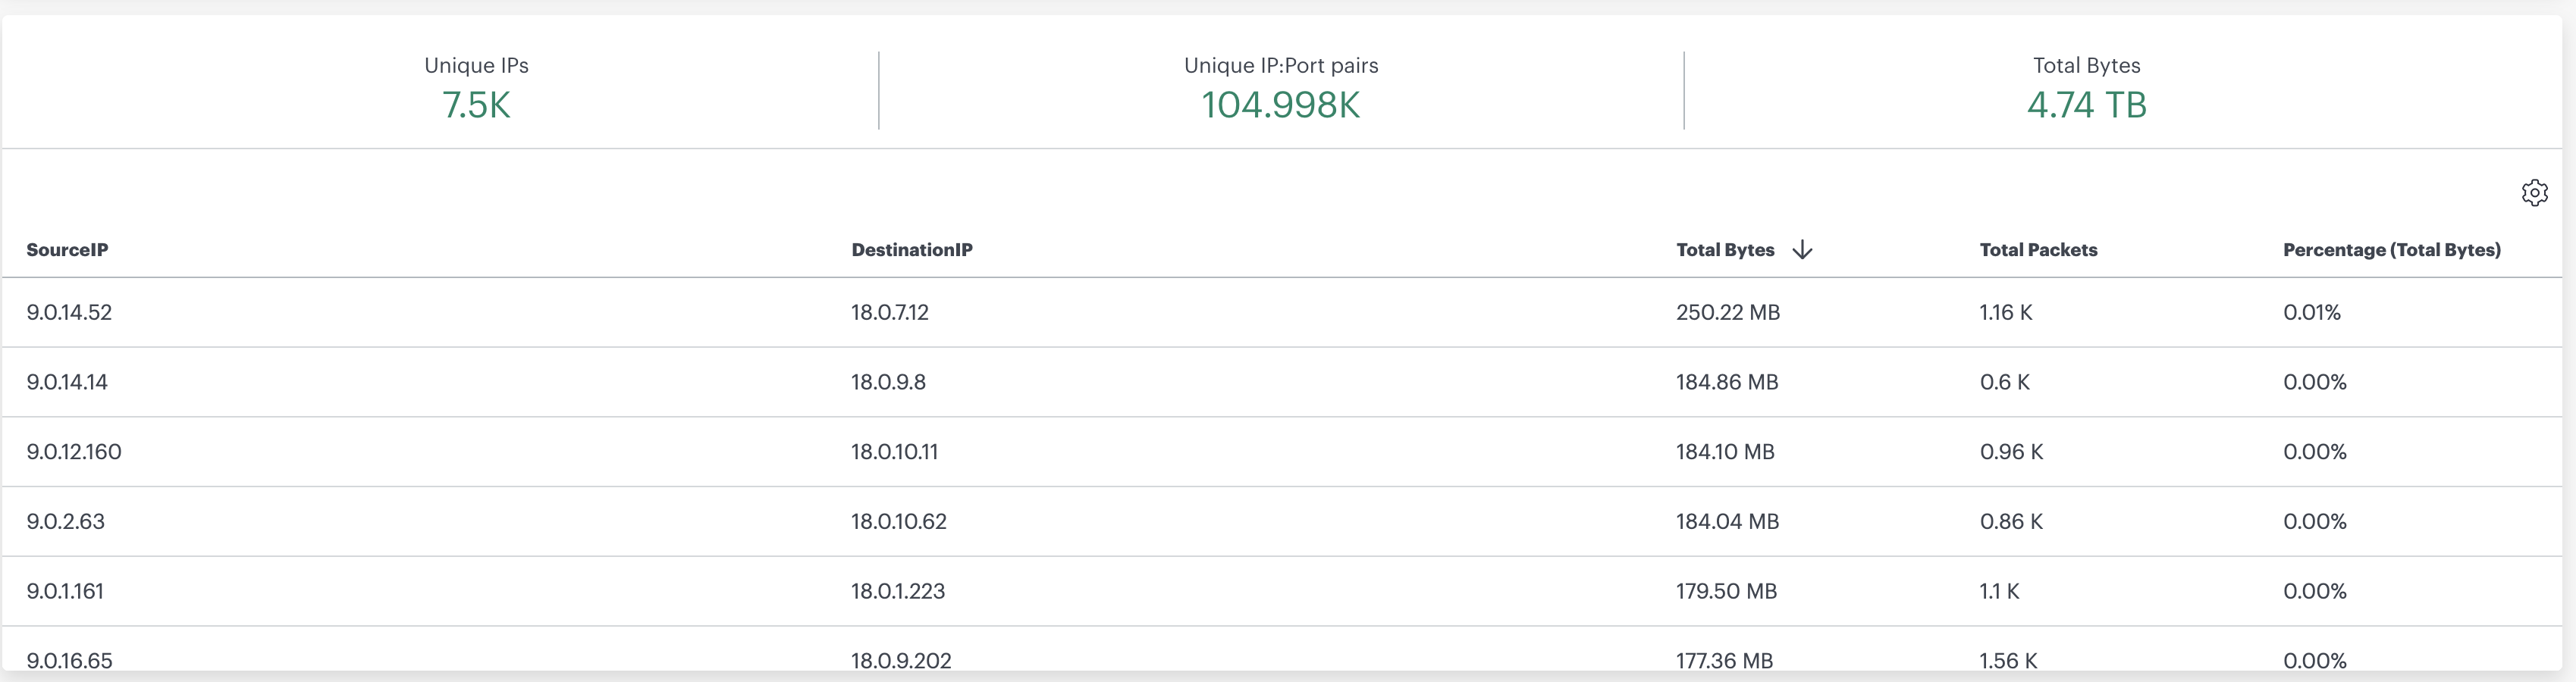
The dashboard is also designed to offer insights into various aspects of network traffic, including unique IPs, unique IP pairs, total bytes transferred, and conversations.
Unique IPs: This section displays a count of unique IP addresses observed within your network environment. This metric helps you understand the number of distinct devices or endpoints communicating across your network.
Unique IP:Port pairs: You will find a count of unique combinations of IP addresses and port numbers observed in network traffic. This metric provides insights into the diversity of communication channels and services utilized within your network infrastructure.
Total Bytes: This section presents the total volume of data transferred over the network during the specified time. Monitoring total bytes helps you track overall network utilization and identify periods of high or low data activity.
Conversations: This table offers a detailed view of communication exchanges (conversations) within the network. The table columns update dynamically based on the selected GROUP BY fields. Any fields added to GROUP BY (for example, sourceIP, destinationIP, srcPort, destPort, dscp, protocol, and tcpFlags) appear as columns in the table, along with Total Bytes, Total Packets, and Percentage (Total Bytes).
You can sort the conversations table based on various criteria to identify specific communication patterns.
To select a source or device from the Conversations, click on the respective row corresponding to the source or device. Upon clicking, the dashboard will redirect you to the resources page, where you can view detailed information about the selected source or device.

Total TCP Connections
The Total TCP Connections is a field added to the NetFlow widgets to provide insights into the total number of TCP connections initiated during the selected time interval.
Note
The “tcpFlags” and “Total TCP Connections” represent the same data. Use only one of them—either add tcpFlags as a GROUP BY dimension or enable the Total TCP Connections column from the Conversations table settings (gear icon). Using both at the same time is not supported.To enable Total TCP Connections:
Click the settings icon to open the Column Settings dialog box.
Select the Total TCP Connections checkbox.
Click UPDATE.

The Total TCP Connections column now appears in the table and displays data.

Related Topics
Click the NPM overview Dashboard icon to navigate to NPM Usage/Health Statistics section.
