OpsRamp offers comprehensive Oracle Database Monitoring to help you track the performance and availability of your Oracle database environment. This monitoring capability provides ready-to-use metrics that enable you to quickly assess the health of your Oracle servers.
Once logged in to the OpsRamp portal, you can view real-time status updates and performance metrics related to your Oracle Database instances.
To explore the complete list of available OracleDB metrics in OpsRamp, refer to Opsramp DB.
OpsRamp collects Oracle database metrics by executing queries on target Oracle servers using JDBC connections via a Gateway. This setup allows efficient and secure data collection while minimizing the impact on your database environment.
Integration Name
Supported Collector Type
Supported Target Versions
Monitoring Protocol
Oracle Database
Gateway
19.3.0.0.0
JDBC
Introduction
The objective of this document is to help users, who are completely new, to create query based (Oracle) custom monitors development in the OpsRamp. This document provides a complete user guide to implement Oracle query based metrics and create monitors and templates. Also explain end to end along with Troubleshooting steps and FAQs which are related to OracleDB Monitoring.
Note
The Oracle Query-Based Monitoring is completely related to Classic Application Monitoring and does not pertain to the SDK app.
What is Oracle Database Monitoring?
OpsRamp provides Oracle Database Monitoring, which offers readily available performance metrics that enable users to effortlessly visualize the health and availability of their Oracle Database environment. With a simple login to the OpsRamp portal, users can access and view the status updates and performance metrics specific to Oracle servers.
For all available OracleDB metrics in OpsRamp, refer to Oracle DB.
How Oracle Database Monitoring works
This monitoring functionality operates by executing Oracle queries on target Oracle servers via a Gateway using JDBC connections. However, users must adhere to specific prerequisites outlined in the following sections, which will be elaborated upon below.
Prerequisites
Create and assign credentials of type Database before assigning a template on a resource. The Port, Connection Time-out, and Is Secure properties are not considered from credentials.
Ensure a Gateway Management Profile is correctly mapped to the target resource. Use Gateway version 14.0.0 or later. It is recommended to use the latest version to ensure full compatibility, access to recent enhancements, and bug fixes.
The Gateway must be able to access the database port (default port is 1521).
For all the global on-premises Oracle query-based templates, Oracle user needs to have SELECT_CATALOG_Role or above, they work on both Standalone and RAC setups.
Setting Up Credentials
To enable Oracle Database Monitoring in OpsRamp, you must create credentials of a Database type. These credentials are required before assigning a monitoring template to the resource.
Create the credentials in OpsRamp with the type Database.
Ensure the credentials belong to a user with the necessary database privileges.
These credentials are used to authenticate via JDBC when querying the Oracle database.
Note
The values for Port, Connection Timeout, and Is Secure fields are not used during credential creation.
Required Database Privileges
The Oracle user associated with the credentials must have the following minimum privileges for monitoring to function correctly:
Privilege
Description
Example
CONNECT
Allows the user to connect to the Oracle database. This is required before assigning additional privileges.
GRANT CONNECT TO MY_USER;
SELECT ANY DICTIONARY
Enables access to Oracle performance and dictionary views. This is the minimum privilege required to monitor all G2 templates.
GRANT SELECT ANY DICTIONARY TO MY_USER;
These privileges ensure that the platform can retrieve performance and health metrics from OracleDB using the predefined templates.
Oracle DB monitoring sends alerts with specific reasons instead of generic ones. are sent for a particular instance by considering both the instance name and the monitor Name.
This provides you with the following benefits:
Increased visibility to determine whether the issue is related to credentials, configuration, or other causes.
Identify the exact root cause of the issue.
Avoid repeated alert noise.
Template Usage guidelines for On-Premises Templates
Users will see some or all of the following configuration parameters when creating template / assigning a template to a device. These parameters are described as follows:
collector.application.type – This is a mandatory parameter. Proceed with the default values, i.e. ORACLE_DB.
connection.timeout.ms – This is a mandatory parameter. Proceed with the default value, i.e. 15000 ms (If required, you can increase it, but it should be well within the monitor frequency/poll time).
oracledb.service.port - This parameter can be used if Oracle database has only one port. Proceed with the default value, i.e. 1521 (If target Oracle environment is running on a different port, then change it to the right port number). If there are multiple ports for multiple db instances, then we will consider port value from oracledb.dbname.list parameter.
oracledb.service.transport - This is an optional parameter. Select correct secure/insecure transport type. If an Oracle database listener is configured on TCPS, set this parameter as secure, otherwise select it as insecure.
oracledb.tls.connection - This is an optional parameter, and must be used only when oracledb.service.transport parameter is set to secure. This configuration parameter is introduced to allow users to monitor the secure/encrypted databases(TCPS protocol). For encrypted database monitoring mark it as Yes. (Supported Gateway version - 17.0.0 onwards).
oracledb.dbname.list - This is a mandatory parameter. Provide database instance name here.
If the target Oracle environment has multiple database instances running on the same port - provide input like InstanceName1, InstanceName2, …etc.
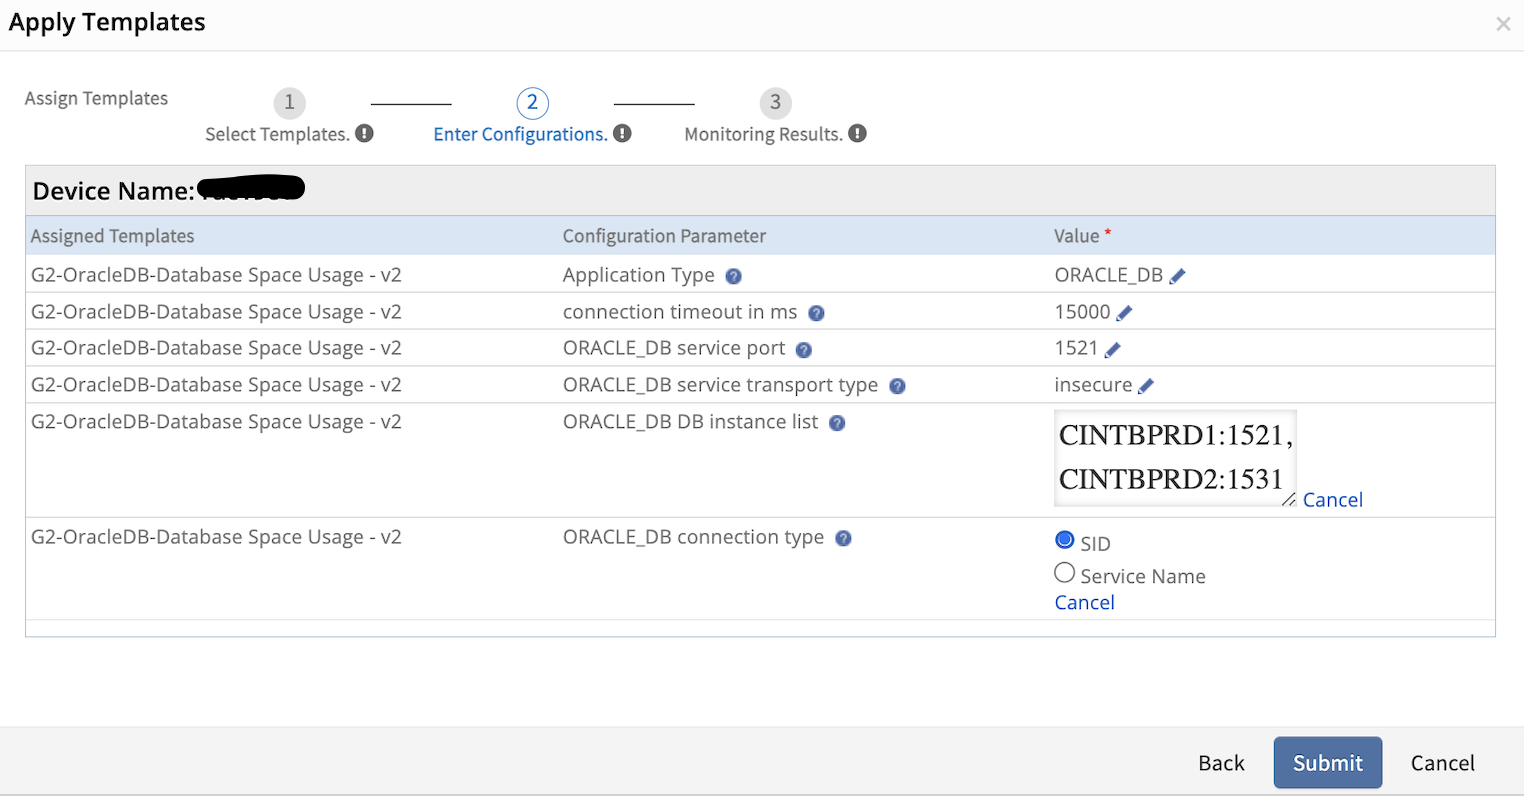
If the target Oracle environment has multiple database instances and each one is running on different ports - provide input like InstanceName1:Port1, InstanceName2:Port2,….etc.
oracledb.connection.type – This is an optional parameter. If the user does not add this parameter while creating monitor, then we will consider instance names as SIDs. Select SID / ServiceName. Below are the differences between both SID & ServiceName in Oracle environment.
SID – This is specific to a database, it is unique in an environment and points to one and only one database in that environment.
ServiceName – This can be associated with one or more SIDs like in a RAC environment where each instance is uniquely named, yet all can be accessed through the SERVICE_NAME.
Database Discovery and Monitoring
OpsRamp supports both agent-based and agentless (gateway-based) monitoring of Oracle Database servers. This section describes how to discover OracleDB resources and prepare them for monitoring using a Gateway.
Discovery using the gateway
The OpsRamp Gateway connects to Oracle databases using the Java Database Connectivity (JDBC) API and collects performance metrics through SQL queries.
Use one of the following mechanisms to discover OracleDB servers to add them to your inventory:
WMI
SSH
SNMP
Optionally, add a database server manually to the infrastructure inventory:
Select Infrastructure and click Resources.
Click the Settings icon on the top-right and click Add.
On the Add Device page, enter the Device Type and any other information you want to enter.
Click Save.
Prepare the device to start monitoring
Associate appropriate database credentials to the discovered database.
Assign one or more database-specific global monitors or templates on the device. Optionally, create custom metrics or monitors using SQL queries and assign them to the database.
OpsRamp comes with a predefined set of Oracle metrics. However, for users who want any customization and the ability to create their own monitoring solutions, we offered UI-based support for creating Oracle metrics.
To prepare Oracle metric, users must return maximum one or two fields from the query. Please follow below use cases along with examples to understand how to write queries to monitor Oracle environment.
How to prepare an Oracle Metric Query
Metric with no components
If the user wants to prepare metric query for the direct value without any components, then user should return only one column from the query result. Here the value will be considered as metric value.
Examples
To monitor total count of the Oracle locked users:
Query - select count(username) as "Number of Locked Users" from dba_users where account_status = 'LOCKED(TIMED)'
The above metric query output is the count value of the Number of Locker Users. Here our framework should consider the value as metric value.
To monitor total count of Invalid Oracle objects:
Query - SELECT count(object_name) FROM dba_objects WHERE status = 'INVALID'
The above metric query output is the count value of the Invalid objects. Here our framework should consider the value as metric value.
Metric with multiple components
If the user wants to prepare a metric query for multiple component-based metrics, then the user should return two columns from the query result. In this example, Column 1 will be considered as Component Name and Column 2 will be considered as Metric Value.
Example 1: To monitor the states of each Oracle tablespace.
Query: select TABLESPACE_NAME, STATUS from DBA_TABLESPACES
The framework should consider the first column TABLESPACE_NAME as the component name and second column STATUS as metric value.
Example 2: To monitor the status of each Oracle instance.
Query: SELECT instance_name, status FROM gv$instance
The framework should consider the first column instance_name as component name and second column status as metric value.
Note
Users must need to follow these use cases while preparing queries for DB query-based monitoring.
If the user prepares metric query for multiple components, then the OpsRamp framework showcase component names in the following format: <InstanceName-ComponentName> or <Port_InstanceName-ComponentName> (Port number is added if target environment has multiple instances with different ports).
Metric query returns maximum two columns only. If it returns one column consider as metric value and if it returns two columns, first column as componentName and another column as metric value.
Metric value could be number only. If it returns string-type values, then must use enumerated mappings, otherwise graphs are not plotted. For more details, see How to handle enumerated mappings & Alerting.
How to calculate/format metric values with example queries
The following examples show how to calculate metric values like utilization, memory usage conversions (like GB to MB), time conversions (like seconds to milliseconds), etc.:
Example 1: To monitor utilization of each ASM disk group
Query:SELECT NAME, Round(( ( total_mb - free_mb ) / total_mb ) * 100) AS "Usage %" FROM v$asm_diskgroup WHERE state = 'CONNECTED'
Example 2: To monitor the size (in MB) of each Arch file
Query: select name, ROUND((blocks*block_size)/(1024*1024), 2) as "SIze(MB)" from v$archived_log
Example 3: To monitor the average global lock get time (in milliseconds)
Query: select ROUND((b3.value / (b1.value + b2.value) * 10),2) "AVG GLOBAL LOCK GET TIME (ms)" from v$sysstat b1, v$sysstat b2, v$sysstat b3 where b1.name = 'global lock sync gets' and b2.name = 'global lock async gets' and b3.name = 'global lock get time' or b1.name = 'global enqueue gets sync' and b2.name = 'global enqueue gets async' and b3.name = 'global enqueue get time'
How to handle enumerated mappings & Alerting
Enumerated Map:
OpsRamp monitoring framework exclusively supports number-type metric values. Therefore, users are required to return metric values as numbers rather than strings or other data types. However, if users wish to return metric values as strings, an option for enum mappings is available. Below are a few examples providing further clarification:
Examples: To monitor the state of Oracle ASM Disk groups, it is important to note that disk groups have direct possible states. In such cases, users must prepare a query to directly return the state value for each disk group, as illustrated below:
Query: Select NAME, STATE from V$ASM_DISKGROUP
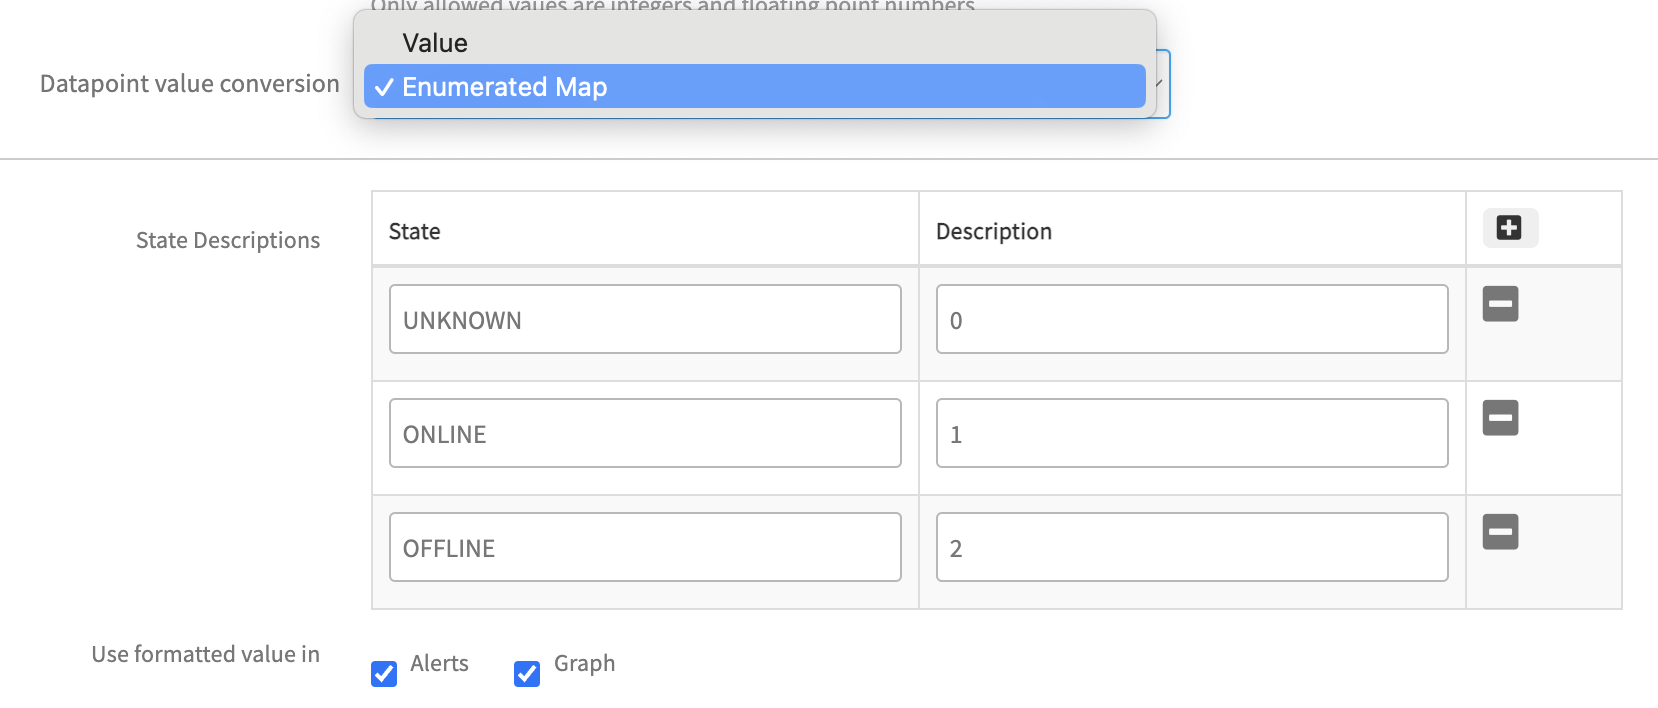
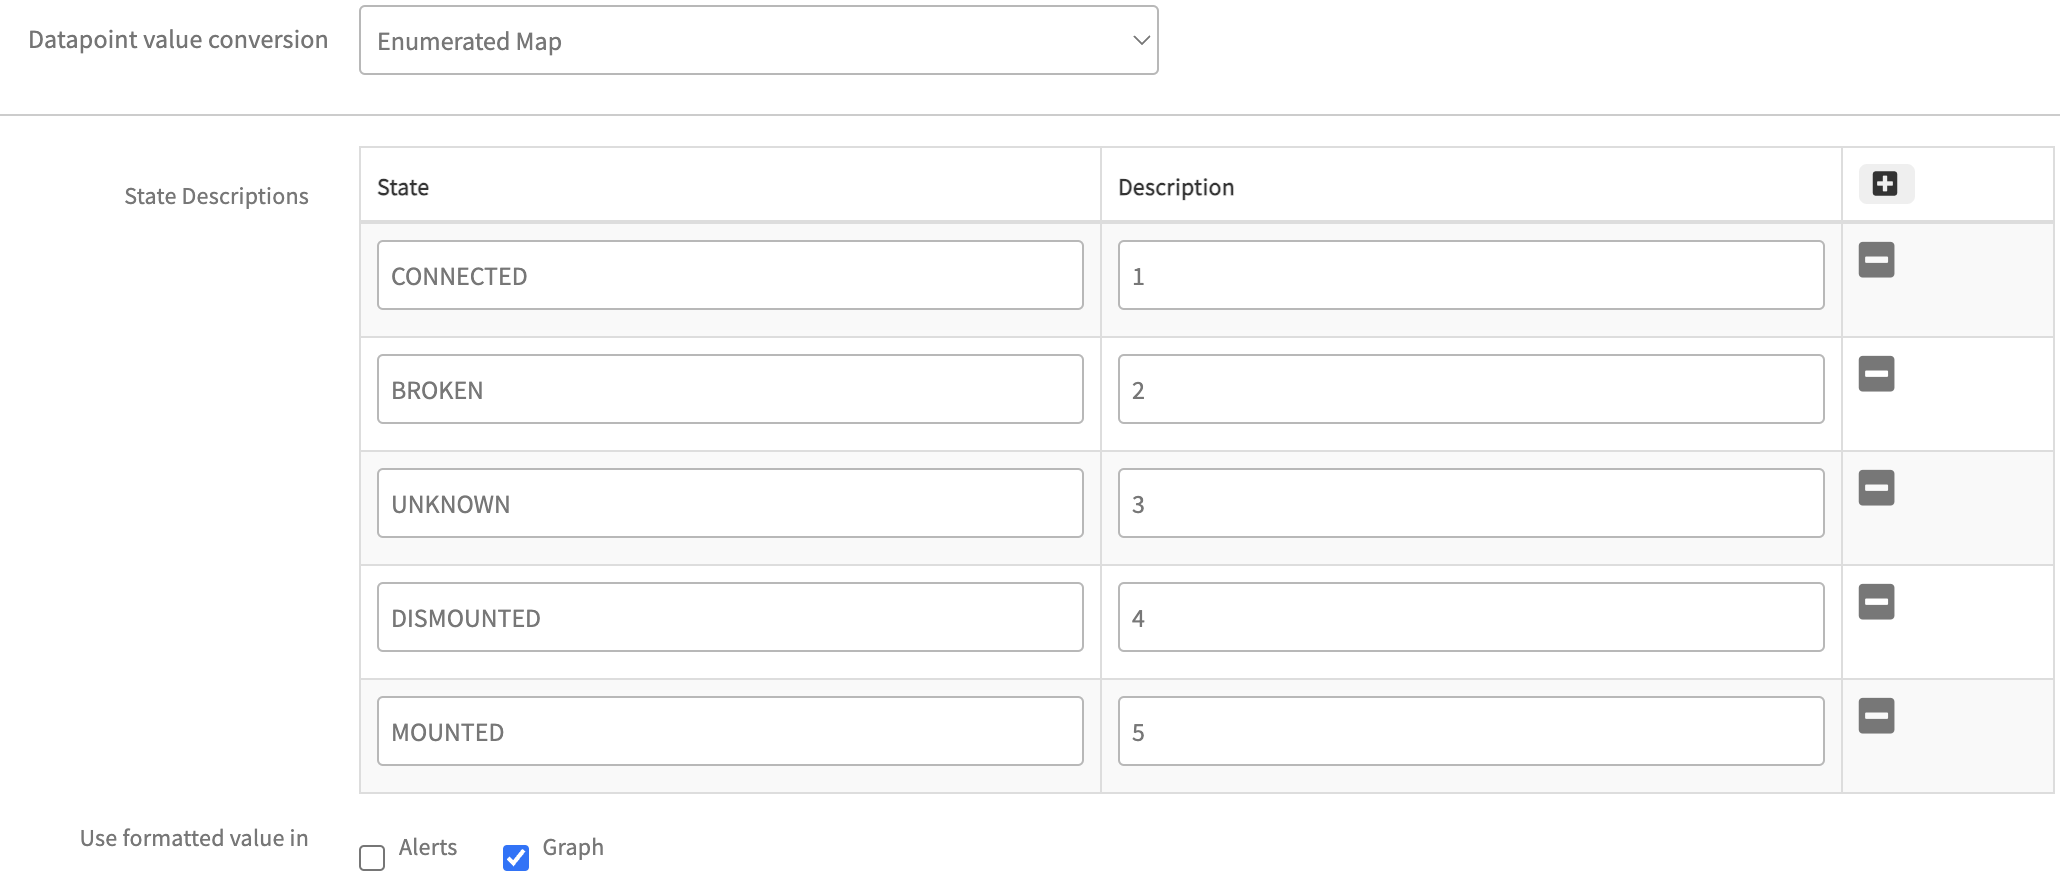
When creating a metric, users are required to select the Datapoint Value Conversion option as Enumerated Map and provide integer value mappings for each possible state, as demonstrated below:
Additionally, there is an option to enable Use formatted value in Alerts & Graphs. If users opt to enable this feature, the enumerated mapping values provided will affect Alerts & Graphs. Otherwise, these values will not be reflected anywhere. The below screenshots have enum mapping reflections in monitoring data:
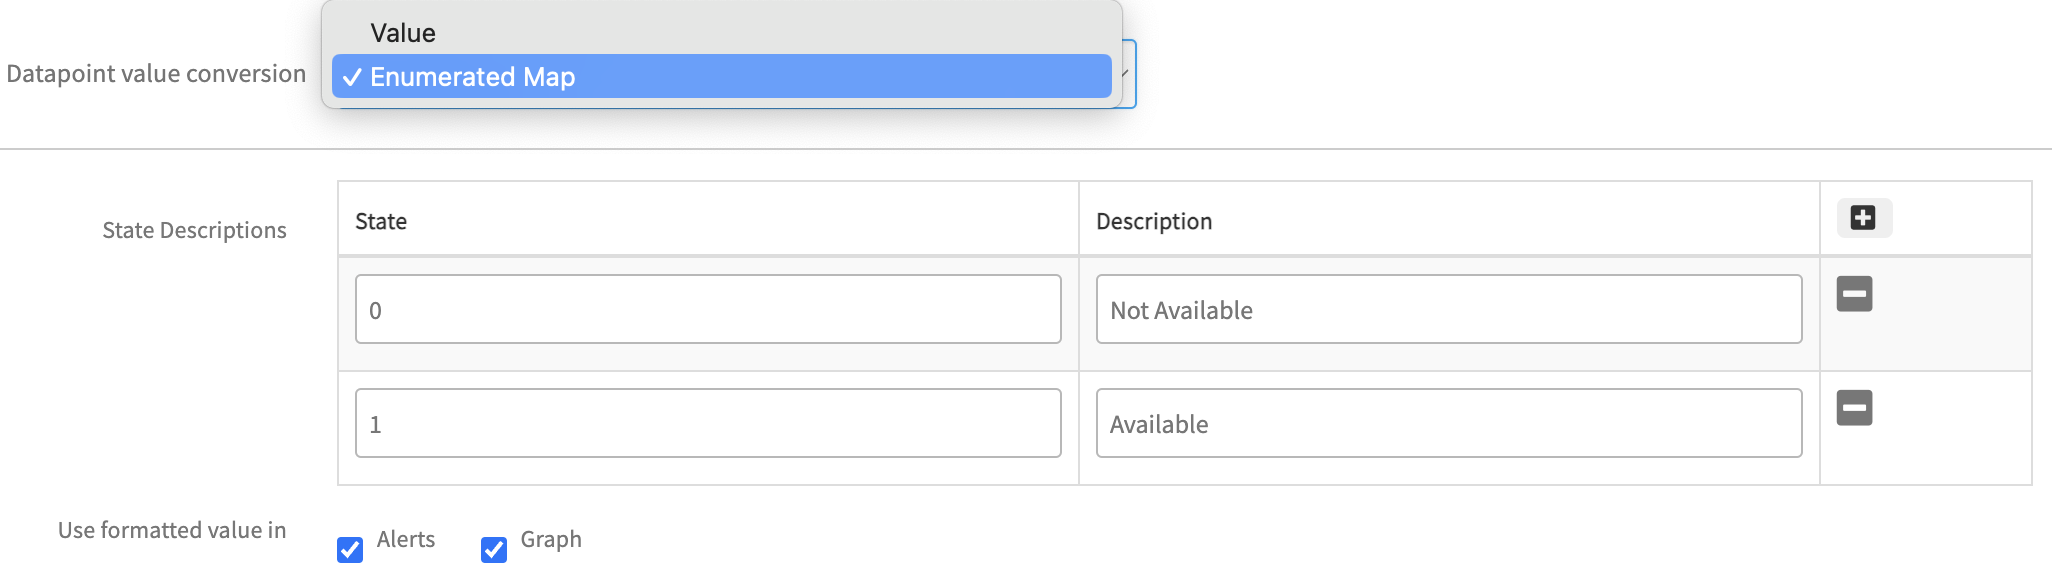
If the user provides string value mappings for each possible state (i.e. integer-type values to string-type values) as demonstrated below:
The above configuration will be reflected in monitoring data like below:
Alerting:
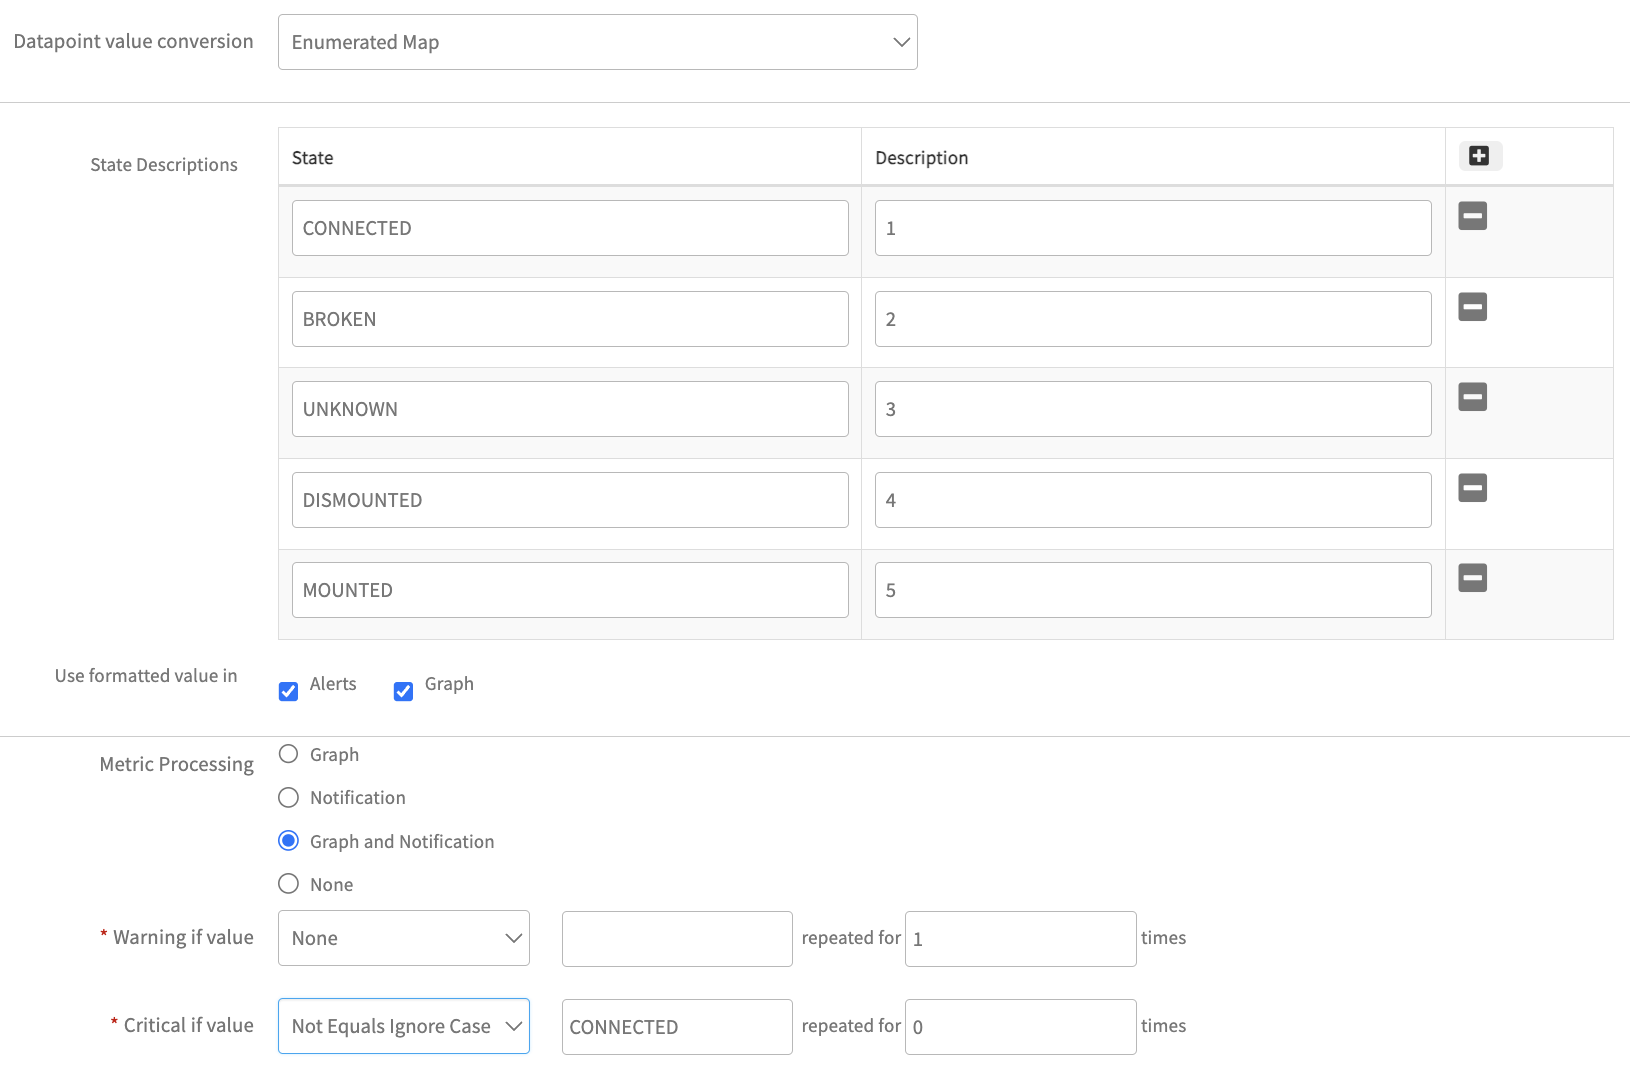
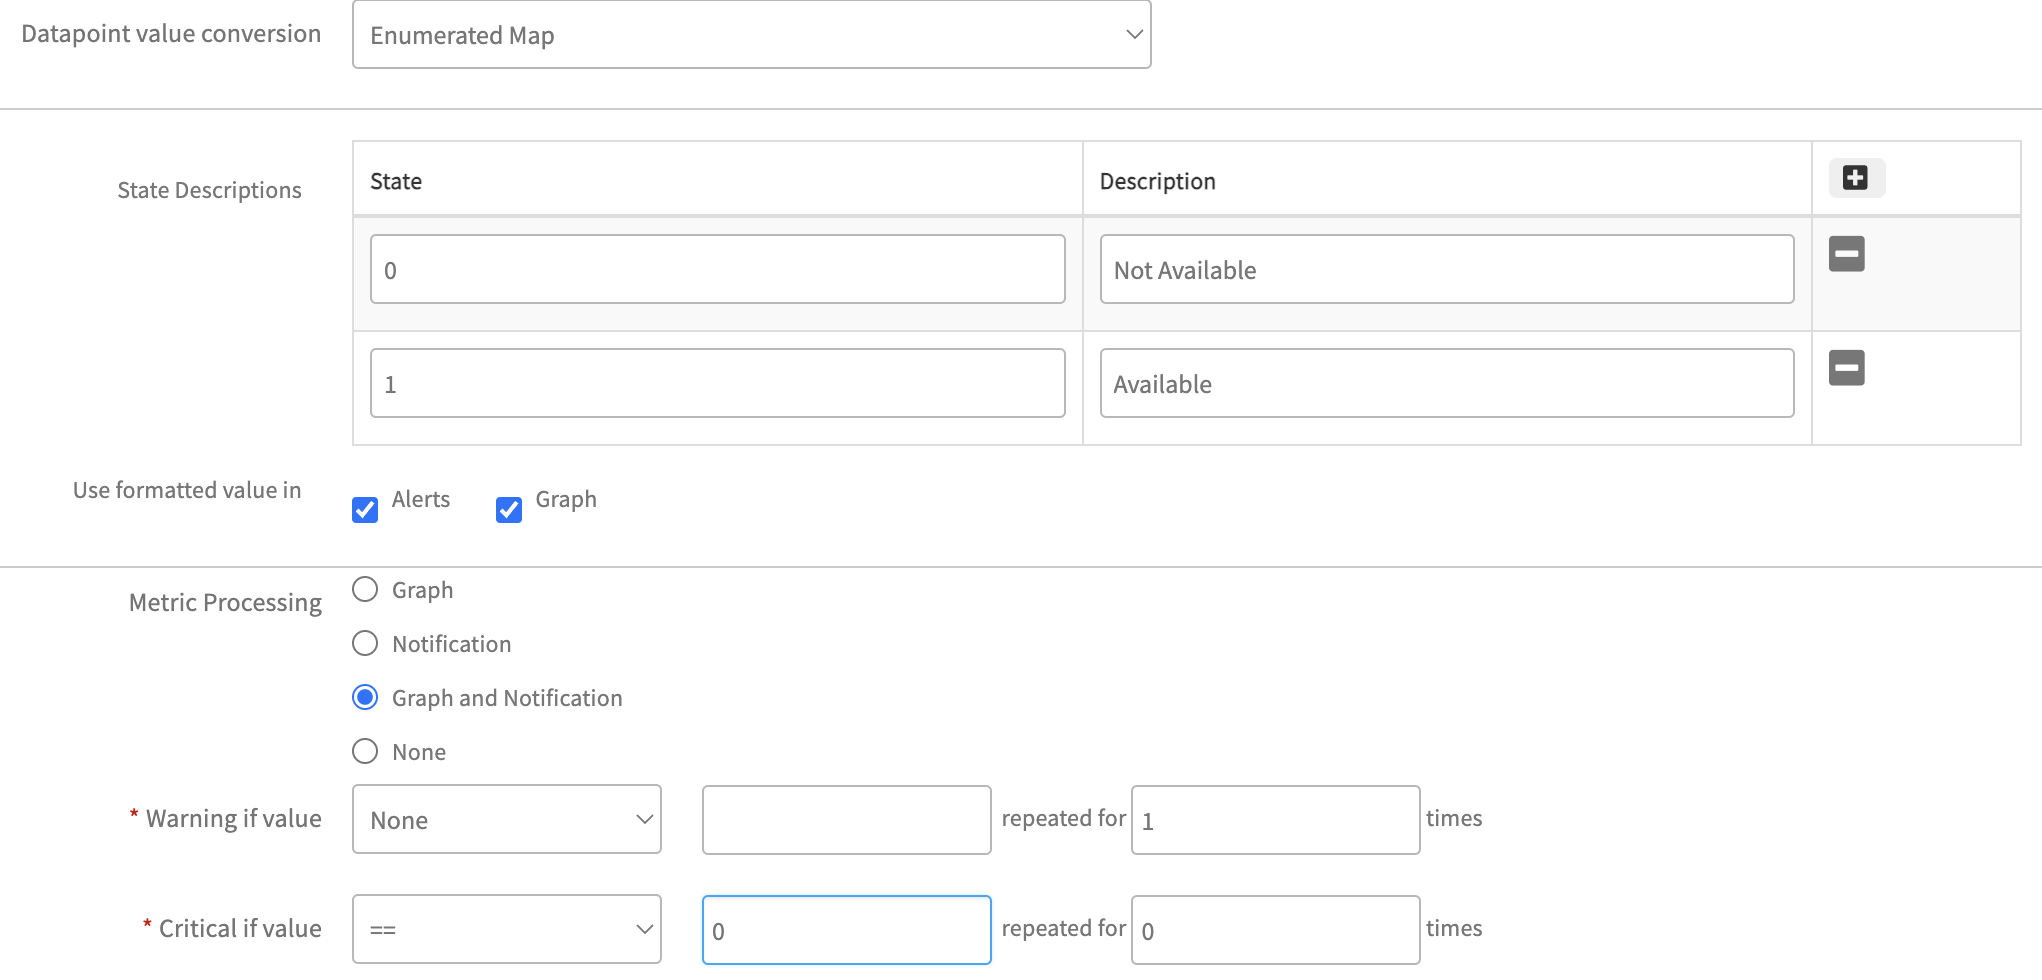
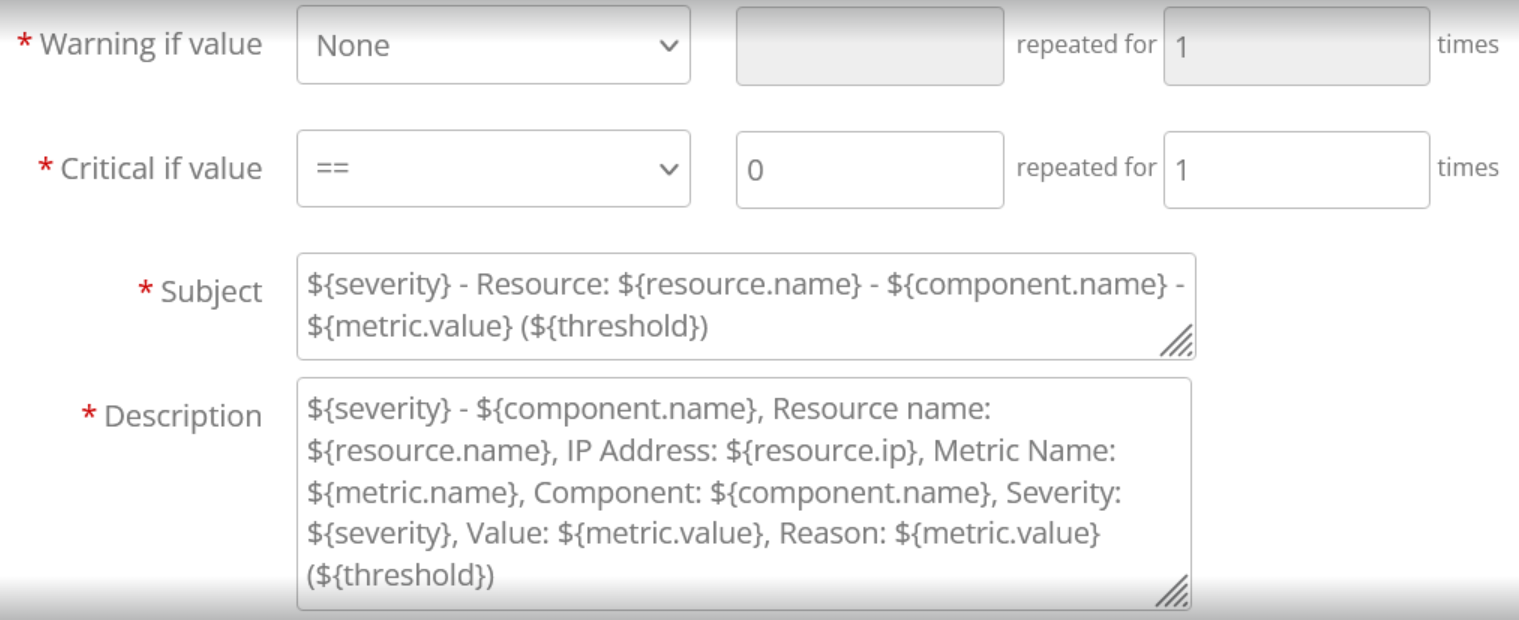
If the metric has an enumerated map enabled, users must follow the instructions below to select critical and warning alert conditions for alert creation.
As outlined above, the prepared query returns the metric value as a string type. In accordance with this, users need to add N-number of enum maps for each possible state to different integer values.
To enable critical or warning alerts, users must take into account the possible string-type values returned from the query.
See the below screenshot for guidance on enabling critical alerts if the enumerated map (string type to integer type) is enabled:
See the below screenshot for guidance on enabling critical alerts if the enumerated map (integer type to string type) is enabled:
How to Create an Oracle Metric
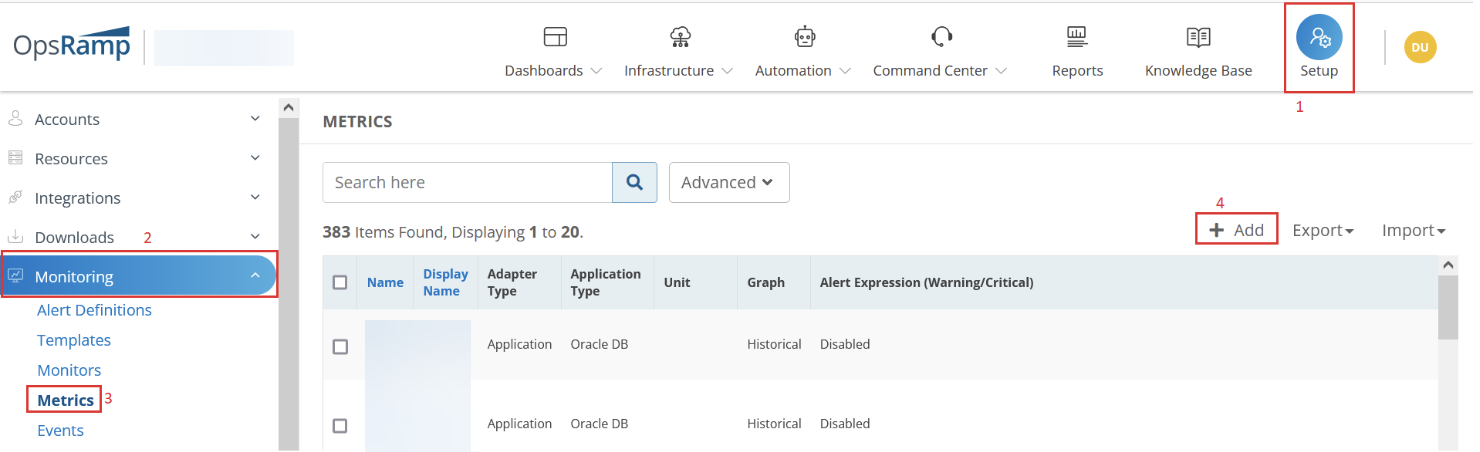
Login to OpsRamp platform and click on Setup from top menu and expand Monitoring from the side bar menu and click on Metrics.
Click on +Add to create a new metric.
Configure the following parameters on the Create Metric page:
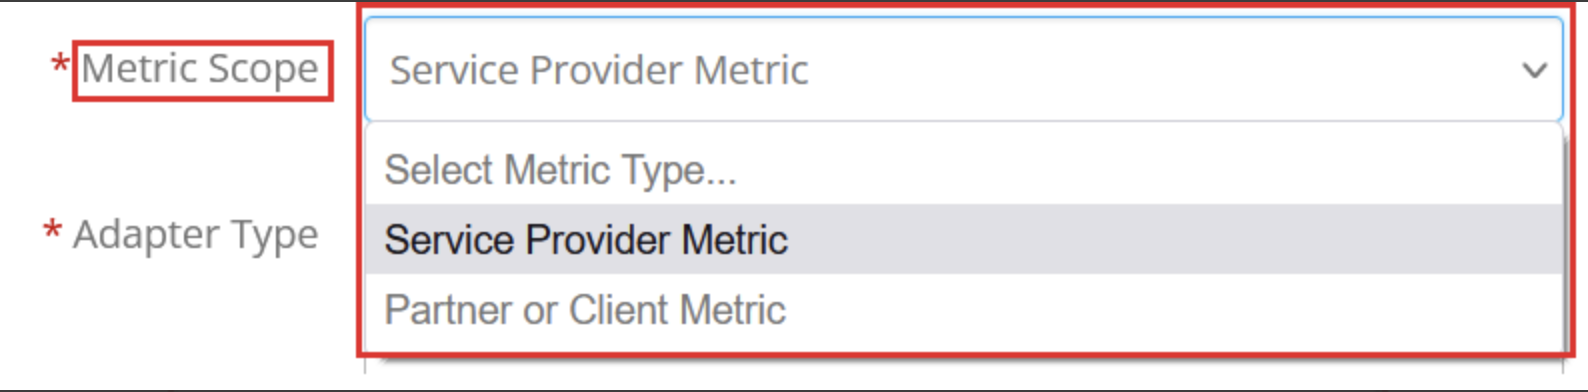
Metric Scope: Select either Service Provider Metric or Partner or Client Metric. Based on your access level and role, you might see this menu slightly different. If you have chosen Partner or Client Metric you will be prompted to choose a Partner/Client from contextual drop down which is dynamically populated.
Adapter Type: Select Application from this dropdown.
Application Type: Select Oracle DB from this dropdown.
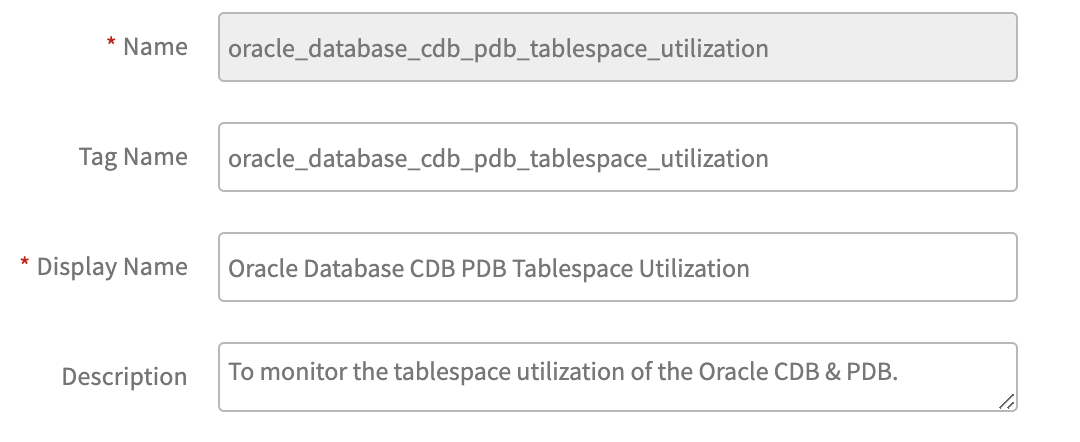
Name: Provide a meaningful metric name.
Tag Name: It will be filled automatically with the same metric name.
Display Name: Provide a meaningful metric display name.
Description: Provide an elaborate description about this metric.
SQL Query: Provide the prepared Oracle query. Note: There is no need to provide semicolon at the end of the query.
Data Point type: Choose a suitable type from this dropdown. It has the following 8 pre-defined types. For this example, will go with Gauge.
Counter Delta: It calculates delta on top of metric value. Counter Delta = (Current poll value - Prev poll value) Note: If the result is less than zero then it returns zero.
Counter Rate: It calculates rate on top of metric value. Counter Rate = (Current poll value - Prev poll value) / (Current poll time - Prev poll time) Note: If the result is less than zero then it returns zero.
Derive Delta: No support in both agent and gateway
Derive Rate: No support in both agent and gateway
Gauge: It returns direct metric value, which is returning from the script.
Rate: It calculates rate on top of metric value. Rate = (Current poll value - Prev poll value) / (Current poll time - Prev poll time) Note: If the result is less than zero then it returns negative value.
Delta: It calculates delta on top of metric value. Delta = (Current poll value - Prev poll value) Note: If the result is less than zero then it returns negative value.
None: Same as Gauge
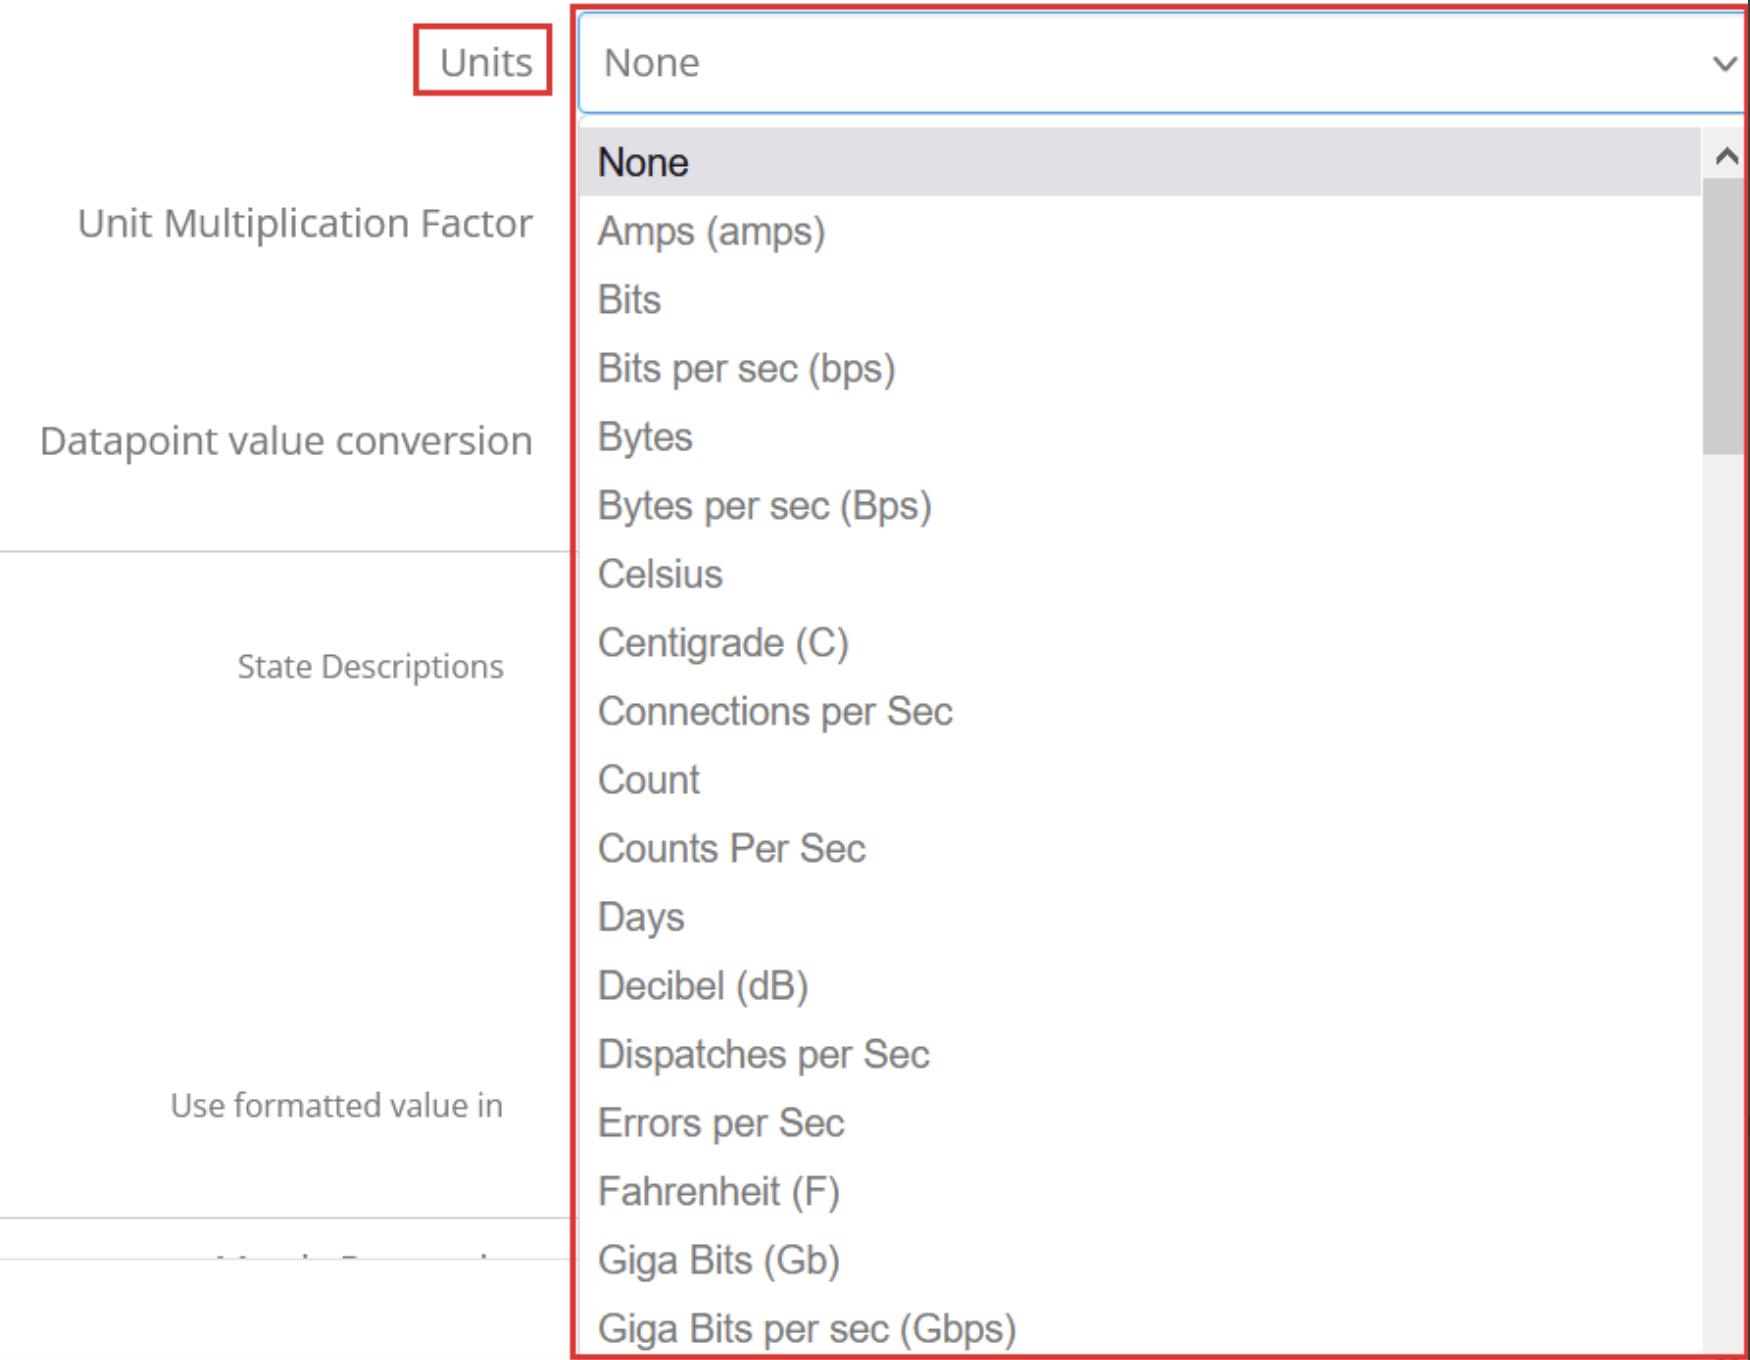
Units: Choose a suitable unit from this dropdown. Status-related metrics do not require any units, so select None.
Unit Multiplication Factor: Value to multiply the metric by. As this is status monitor, it does not require a factor value, so consider default value 1.0.
Datapoint value conversion: Choose a suitable option from any of the below two.
Value = Choose this option (As shown below) when no conversion is required on the metric value. This is the default value for Datapoint value conversion dropdown.
Enumerated Map = Choose this option when enumeration based conversion is required.
For status-related metrics, it is common for queries to return string-type values. However, our monitoring graphs only support integer values. Therefore, users need to provide mappings for all possible string-type values, as illustrated below:
Sometimes, if the query returns direct integer values to the metric, but still the user wants to enable enumerated mapping, then provide an enumerated map in reverse order. In this case, the mapped strings are displayed in the metric graph info page and alerts.
Example:
1 – Running,
0 – Stopped
Based on user requirements, select the Alerts and Graph checkboxes accordingly. When both checkboxes are selected, Graphs as well as Alert subject and details page will display integer values alongside enumeration mappings. Additionally, these mappings will appear in the Get Latest Metric Value page against the metric.
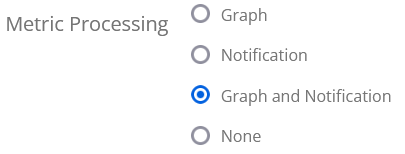
Metric Processing: Choose any of the below suitable option based on your requirement.
Graph – Select if only graph is needed, but no alerting is needed.
Notification – Select if only alerting is needed, but no graphing is needed.
Graph and Notification – Select if both graphing and alerting are needed.
None – Select if both graphing and alerting are not needed. For Notification,Graph, and Notification, below options will populate dynamically:
How to Create an Oracle Monitor
Login to OpsRamp platform and click on Setup from the top menu.
Expand Monitoring from the side bar menu and click on Monitors.
Click on +Add to create a new monitor.
On the Create a Monitor page, configure the following parameters:
Monitor Scope: Select either Service Provider Monitor or Partner or Client Monitor. Based on your access level and role, you might see this menu slightly different. If you have chosen to create the script at Partner or Client level, you will be prompted to choose a Partner/Client from the contextual dropdown, which is dynamically populated.
Adapter Type: Select Application from this dropdown.
Application Type: Select Oracle DB from this dropdown.
Name: Provide a meaningful monitor name.
Description: Provide a elaborate description about this monitor.
Metrics: Click on Add and select all the metrics, which you created in the previous section. Note: Make sure you select the right Oracle DB metrics.
Configuration Parameters: By default, you will see the following configuration parameters:
collector.application.type: Proceed with the default values, i.e. ORACLE_DB
connection.timeout.ms: Proceed with the default value, i.e. 15000 ms (If required you can increase it, but it should be well within the monitor frequency/poll time).
oracledb.service.port: Proceed with the default value, i.e. 1521 (If target Oracle environment is running on a different port, then change it to the right port number.)
oracledb.service.transport: Select correct secure/insecure transport type.
oracledb.tls.connection: This configuration parameter is introduced to allow users to monitor the secure/encrypted databases(TCPS protocol). The default value is No. For encrypted database monitoring, mark it to Yes. (Supported Gateway Version - 14.0.0 onwards)
oracledb.dbname.list: Provide database instance name here.
If the target Oracle environment has multiple database instances running on the same port, provide an input like InstanceName1, InstanceName2, etc.
If the target Oracle environment has multiple database instances and each one is running on different ports, provide input like InstanceName1:Port1,InstanceName2:Port2, etc.
If the target Oracle environment has multiple database instances each running on different ports with a specific connection type, provide input like InstanceName1:Port1:ConnectionType1, InstanceName2:Port2:ConnectionType2, etc. The connection type must be either servicename or sid.
If the target Oracle environment has multiple database instances each running on different ports with specific connection types and instance-specific credentials, provide input like InstanceName1:Port1:ConnectionType1:CredentialName1, InstanceName2:Port2:ConnectionType2:CredentialName2. The connection type must be either servicename or sid. The credential name must match an existing credential created in OpsRamp and assigned to the device.Note: This is supported on Gateway version 21.2.0 or later.
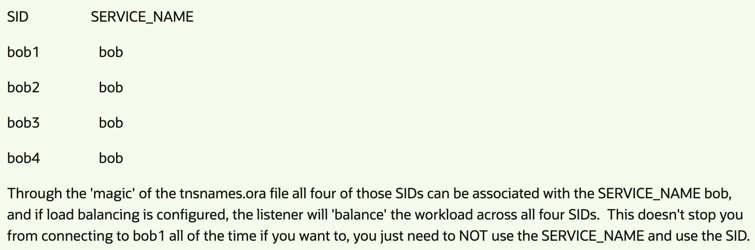
oracledb.connection.type: Select SID/ServiceName. Below are the differences between both SID and ServiceName in Oracle environment.
SID: This is specific to a database. It is unique in an environment and points to only one database in that environment.
ServiceName: This can be associated with one or more SIDs like a RAC environment, where each instance is uniquely named yet all can be accessed through the SERVICE_NAME.
The following screenshot shows an example of SID and ServiceName.
Note
All these fields are default values and can be editable while assigning the template on db resource.
Users have identified database port numbers in multiple areas like DB credentials, oracle.dbname.list and oracledb.service.port. But framework should consider the port number from oracledb.service.port (for single instance), or if the user provides oracledb.dbname.list input like InstanceName1:Port1,InstanceName2:Port2 then framework should consider the port number for each instance.
How to Create an Oracle Database Monitoring Template
Login to OpsRamp platform and click on Setup from the top menu.
Expand Monitoring from the side bar menu and click on Templates.
Click on +Add to create a new template.
The following steps are to configure the Monitor Template page:
Select Template Scope: Select either Service Provider Template or Partner or Client Templates. Based on your access level and role you might see this menu slightly different. If you have chosen to create Partner or Client level, you will be prompted to choose a Partner/Client from a contextual dropdown which is dynamically populated.
Collector Type: Choose Gateway Note: DB Query based monitoring supports Gateway collector type only.
Monitor Type: For Gateway, select Monitors radio button.
Applicable For: Always select Device.
Template Name: Provide a meaningful template name.
Description: Provide an elaborate description about this template.
Leave remaining fields as is and scroll down. Click on +Add against Monitors.
Select Frequency: Select monitoring frequency based on metric requirement.
Monitor Definition: Choose monitor which you created in the previous section.
When To Alert: Proceed with the default option. i.e. Breach of a Threshold.
Click on Add and Save the template.
Assign Template
Login to OpsRamp platform and Choose Partner and Client.
Click on Resources under Infrastructure from top menu.
Look for target device ip/hostname and click on Monitors.
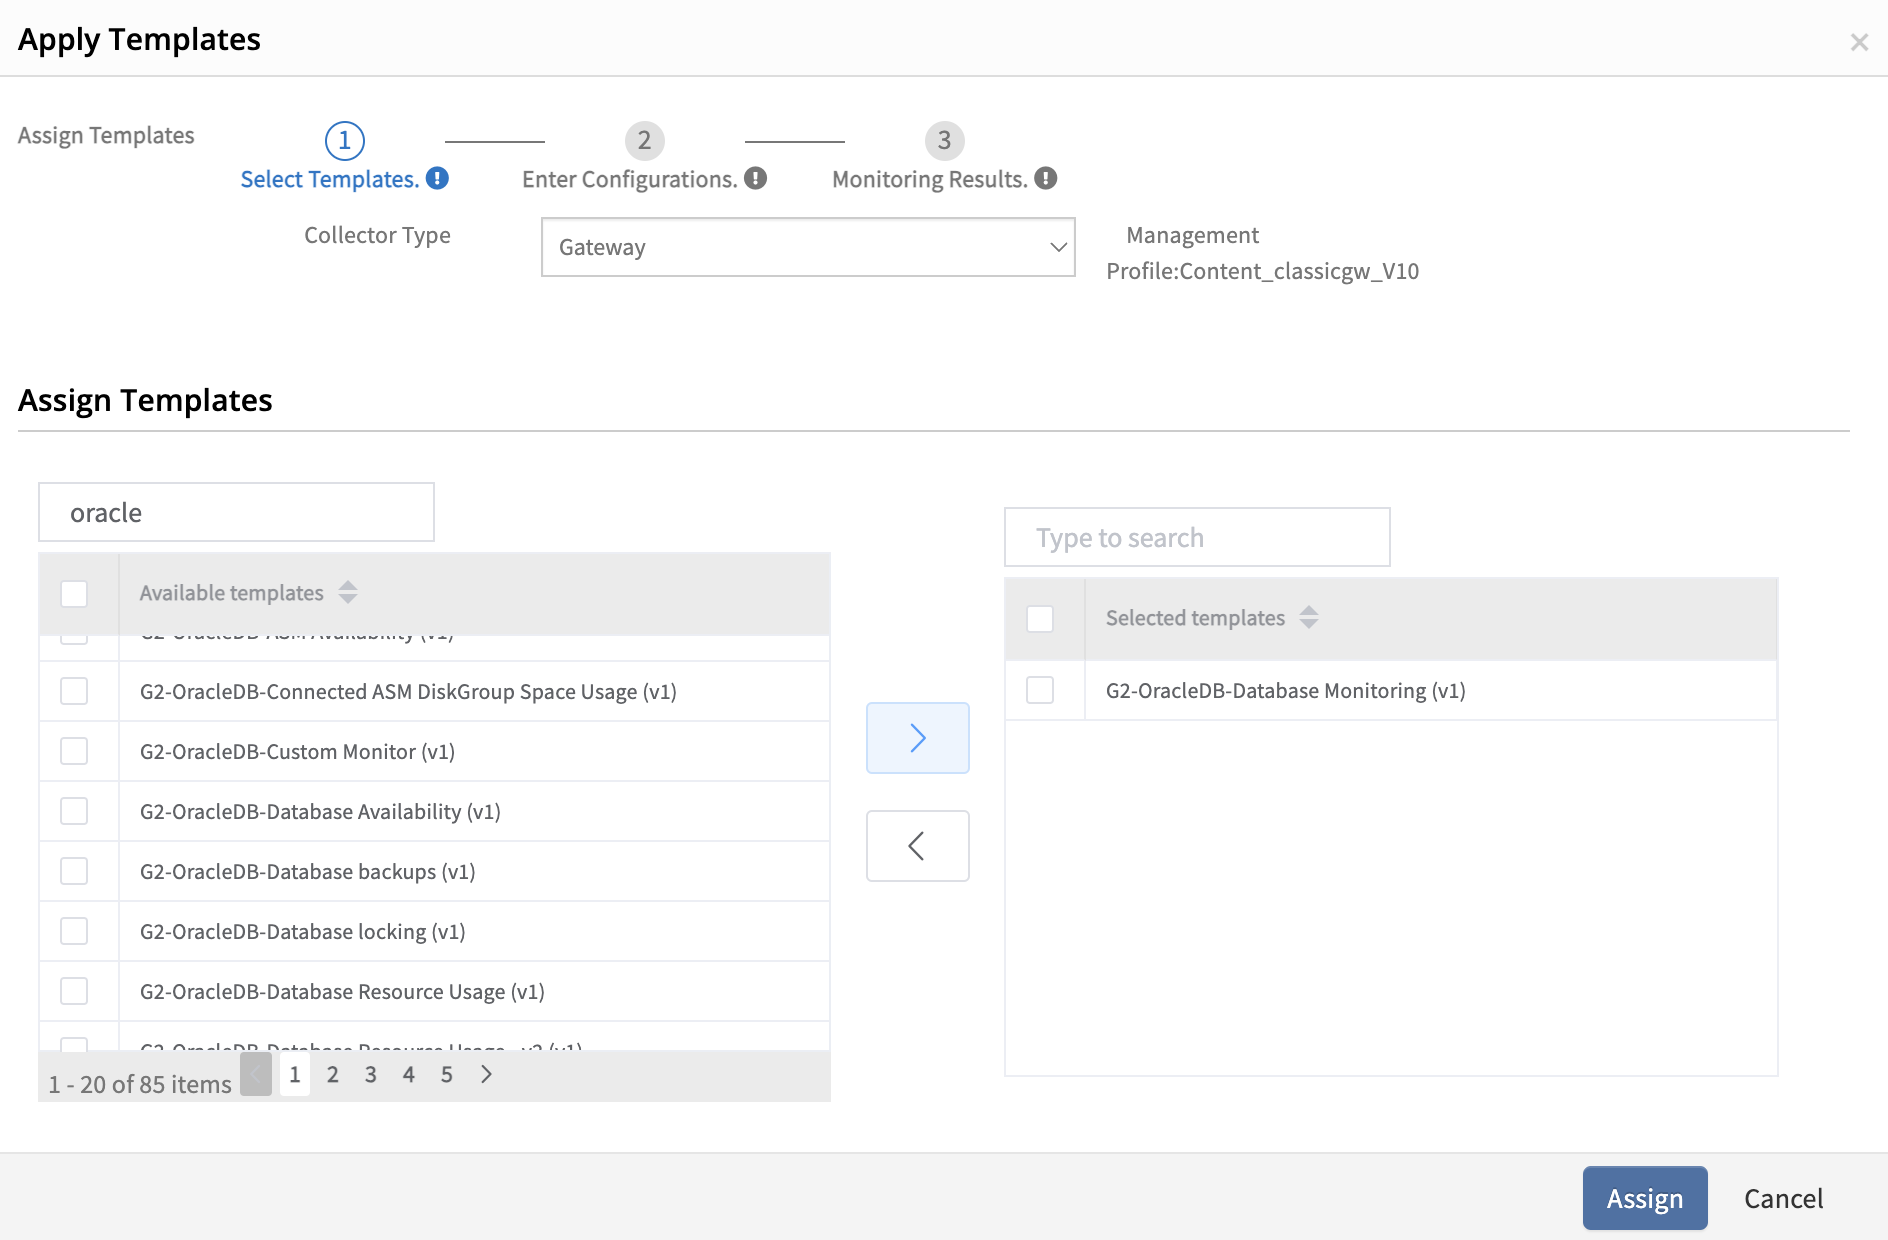
Click on Assign Templates and select Collector Type and search for the Template(s) and click Assign.
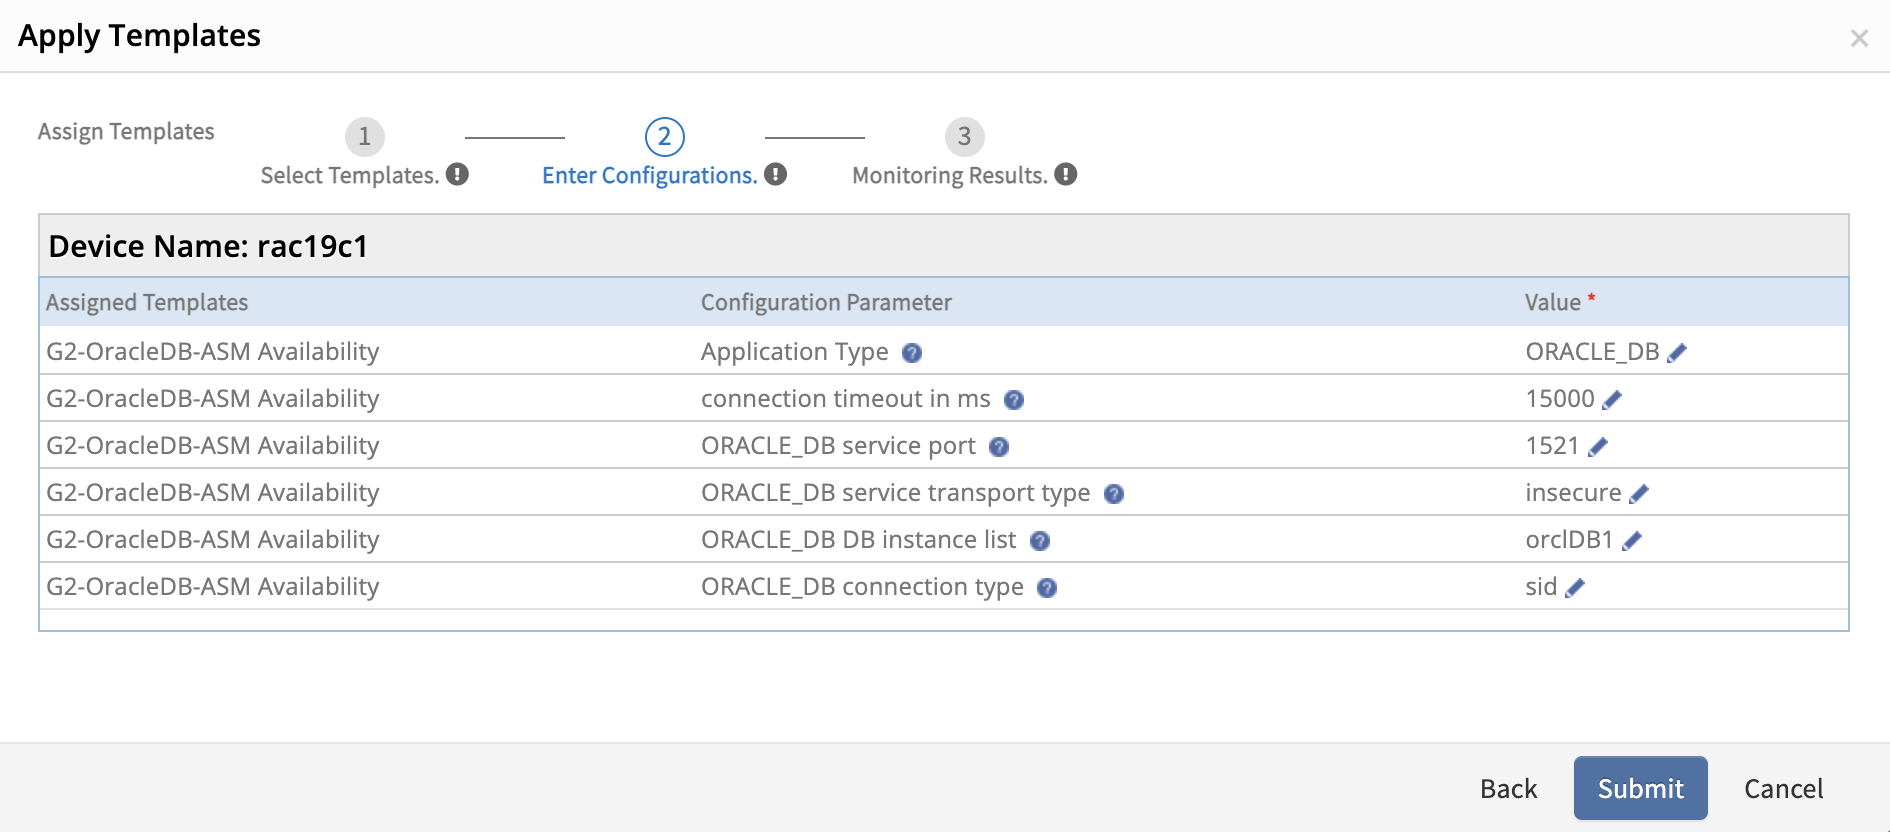
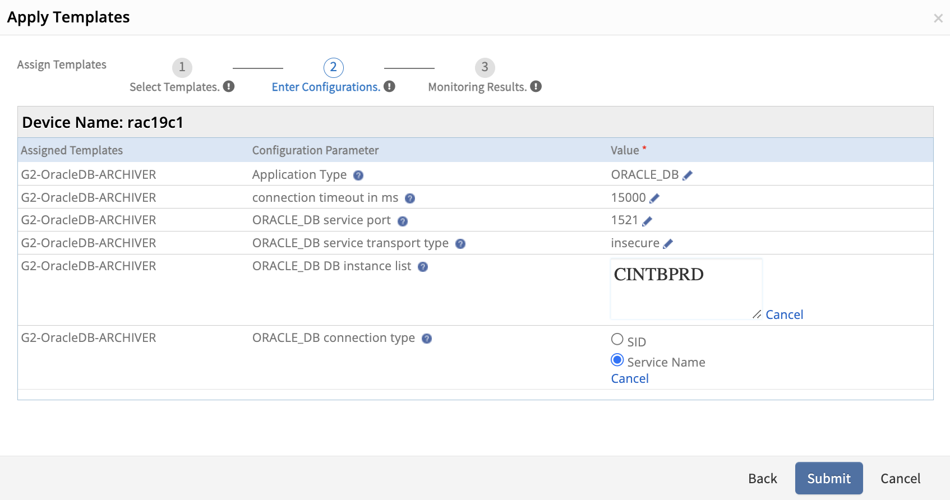
User needs to provide parameters based on their Oracle configuration. By default, it will show default ones like below: Multiple instances with different ports:
User must select the right connection option for oracledb. There are connection type radio buttons (either SID or Service Name). If user selects SID, then must provide correct SID in DB instance list. If the user selects Service Name, then must provide correct ServiceName in DB instance list.
How to update and add Metrics to Monitor, and Monitor to Template
If the user wants to update metrics, monitors, and templates, then they will need to follow the below instructions; otherwise, it will not reflect changes on the target machine.
How to update metrics?
If the user wants to update a query, description, units, enumerated map, and alertTokens, etc. in a metric (Note - Metric Name will not change), that is part of a template, follow the below process:
Navigate to the Setup > Monitoring > Metrics page, open the specific metric.
Update and save the metric.
Open the monitor, reload the updated metric, and save the monitor.
Open the template, re-add the updated monitor, and save the template.
Assign the template to the resources directly or via DMP to see the updated metric changes in the resources.
How to Update Monitors?
If the user wants to update monitor like add/remove metrics, description, or configuration parameters, etc., that are part of a template, follow the below process:
Navigate to Setup > Monitoring > Monitors page, open the specific monitor.
Update and save the monitor.
Open the template, re-add the updated monitor, and save the template.
Assign the template to the resources directly or via DMP to see the updated metric changes in the resources.
Create Oracle Monitoring Templates
Navigate to Setup > Monitoring > Metrics.
Click + Add to create a new metric.
The CREATE METRIC window appears.
Fill in the following in the CREATE METRIC window:
Field Name
Field Types
Field Dependency
Description
Metric Scope
Dropdown
None
Select the scope for the metric. Determines where the metric is created and available. Available options are: Service Provider Metric and Partner or Client metric.
Partner
Dropdown
Appears when Partner or Client Metric option is selected.
Auto-filled with the name of the partner.
Client
Dropdown
Appears when Partner or Client Metric option is selected.
Enter the name of the client.
Adapter Type
Dropdown
None
Choose the adapter category that this metric is associated with.
Name
String
None
Enter a unique internal name for the metric. Used for reference within the platform
Tag Name
String
None
Auto-filled with the metric name. Used for tagging and search purposes.
Display Name
String
None
Enter a user-friendly name that will appear in dashboards, alerts, and metric listings.
Description
String
None
Provide a detailed explanation of what the metric tracks and how it is calculated or collected.
Class/Attribute path
String
None
Enter the path of the attribute or class of the metric.
Category
Dropdown
None
Select the category of the metric.
Units
Dropdown
None
Enter the category of the metric.
Unit Multiplication Factor
Integer
None
Enter a factor to multiply the raw metric value. Default is 1.0. Useful for scaling raw data.
Datapoint value conversion
Dropdown
None
Select the way to handle the metric values. The available options are:
Value: Choose this option (As shown in below) when no conversion required on the metric value.
Enumerated Map: Choose this option when enumeration based conversion is required.
Metric Processing
Radio button
None
Select how the metric should be processed: Graph, Notification, Graph and Notification, or None.
Warning if value
Dropdown
None
Set the warning threshold by selecting a comparison operator (e.g., >=, <=, ==) and entering a value. An alert will trigger if this condition is met.
Critical if value
Dropdown
None
Specify how many consecutive polling intervals this condition must be true before triggering a warning alert.
Subject
String
None
Define the subject of the alert. You can use dynamic variables like ${severity}, ${component.name}, ${resource.name}, and ${metric value}.
Description
String
None
Provide detailed information to appear in the alert body. You can include dynamic tokens to pull in values at runtime for clarity.
Create Oracle Monitor
Navigate to Setup > Monitoring > Monitors.
Click +Add. The CREATE A MONITOR window appears.
Fill in the following in the CREATE A MONITOR window:
Field Name
Field Types
Field Dependency
Description
Metric Scope
Dropdown
None
Select the scope for the metric. Determines where the metric is created and available. Available options are: Service Provider Metric and Partner or Client metric.
Partner
Dropdown
Appears when Partner or Client Metric option is selected.
Auto-filled with the name of the partner.
Client
Dropdown
Appears when Partner or Client monitor option is selected.
Enter the name of the client.
Adapter Type
Dropdown
None
Choose the adapter category that this monitor is associated with.
Name
String
None
Enter a unique internal name for the monitor. Used for reference within the platform
Description
String
None
Provide a detailed explanation of the monitor and how it is calculated or collected.
Version
String
None
Enter the version of the monitor.
Metrics
Checkbox
None
Click +Add to see all the existing metrics that are created in the previous section.
For status-related metrics, it’s common for queries to return string-type values. However, our monitoring graphs only support integer values. Therefore, users need to provide mappings for all possible string-type values, as illustrated below:
SELECT ROUND((b3.value / (b1.value + b2.value) * 10), 2) AS “AVG GLOBAL LOCK GET TIME (ms)”
FROM v$sysstat b1, v$sysstat b2, v$sysstat b3
WHERE (b1.name = global lock sync gets AND b2.name = global lock async gets AND b3.name = global lock get time)
OR (b1.name = global enqueue gets sync AND b2.name = global enqueue gets async AND b3.name = global enqueue get time)
SELECT INSTANCE_NAME, DATABASE_STATUS FROM V$INSTANCE
When creating a custom metric using SQL query, do not add or append a semicolon(;) at the end of the query.
Assign templates from setup
Assign OracleDB templates to one or more resources for a selected client and change the configuration parameters while assigning templates. For more information, see Assign Templates from Setup.
Assign templates at the device level
Applying Oracle templates at the device level helps assign one or more templates to a specific resource. You can change the configuration parameter default values while assigning the templates. For more information, see Assign Templates at the Device Level.
Template configuration parameters:
Configuration Parameter
Description
Connection Time-out
The maximum time to connect to the database. The driver waits for the specified time before timing out due to connection failure. The default time is 15000 milliseconds(ms).
Service Transport Type
To configure the database at a secure end-point. The default type is In-secure. The connection is Secure when the data sent between the client and server is encrypted.
Service Port
The port number where the database is running. The connection is made to the specified port if you specify the port and the database name. The default port is 1521.
DB Instance Name
The database instance name required to establish a connection. The default name is root.
If you have multiple instances with different ports, use the following syntax:
Instance1:Port1,Instance2:Port2
Note: Do not consider the service port configuration value here.The connection type is taken from the Connection Type configuration parameter.
If you have multiple instances with different ports and connection types, use the following syntax:
Note: The connection type must be either servicename or sid. The credential name must match an existing credential of type Database, created in OpsRamp and assigned to the device. This ensures each instance authenticates with the correct credential on the first attempt, preventing unnecessary failed logins and account lockouts (e.g., ORA-28000). This works only with gateway version 21.2.0 or later.
If you have a single instance, use the following syntax:
Instance1
Note: The port and connection type are taken from the Service Port and Connection Type configuration parameters.
If you have multiple databases with the same port, use the following syntax:
Database1,Database2,Database3
Note: The port and connection type are taken from the Service Port and Connection Type configuration parameters.
Application Type
The application type value to identify the adapter. For example, ORACLE_DB. Warning: Do not change the default application type value.
Assign Template from Device Management Policies
Device management policies help manage resources. You can assign monitoring templates, knowledge base articles, and custom attributes using device management policies. The device management policy can be applied to one or a set of resources. For more information, see Create Policies.
View Resource Metrics
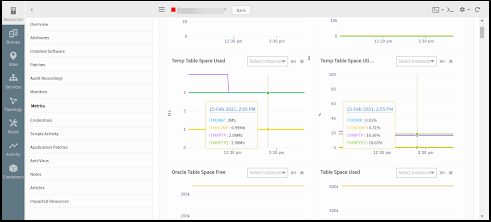
The gateway monitors the application using the assigned templates and displays the results in graphical format. To view resource metrics, click the database resource name > resource Details > Metrics.
Points to Be Considered
Select Gateway as collector type while creating a template.
Assign the right Oracle database credentials (which have all required privileges to execute metric queries) on the target Oracle server.
Note: Multiple credentials were configured, and both could connect to the device. OpsRamp selected one of them, but that credential did not have enough permissions to collect the monitoring data, so some metrics were missing. OpsRamp switches to another credential only when the connection itself fails. In this case, the connection succeeded, so OpsRamp did not recognize the permission problem as a reason to try the second credential. It therefore continued using the connected but underprivileged credential. When that credential was removed, OpsRamp had to use the remaining credential, which had the required permissions. Data collection then resumed and the template worked correctly.
If you have instance-level authentication, assign all credential sets on the target Oracle server so that OpsRamp Gateway can connect and fetch metric data for all db instances.
Need to provide correct instance SID or ServiceName to connect the Oracle Instance.
To provide right transport type like secure or insecure.
While preparing Oracle query, you must return maximum of one or two fields from the query and you should not consider frequently changed columns as component names (like Oracle session name, userName, etc.) or any combinations (like databaseName_sessionId, tablespaceName+userId, etc.).
If any database connectivity issues occur from the Gateway, the Framework generates alerts such as oracledb.auth.error. However, it does not generate alerts for query syntax errors, empty data, or access denied issues.
Troubleshooting
Use case 1 - Failed to get latest metric values/Gateway is offline
When the user applies an Oracle monitoring template on devices and encounters the message Failed to get latest metric values/Gateway is offline while fetching latest metric data, follow the below steps:
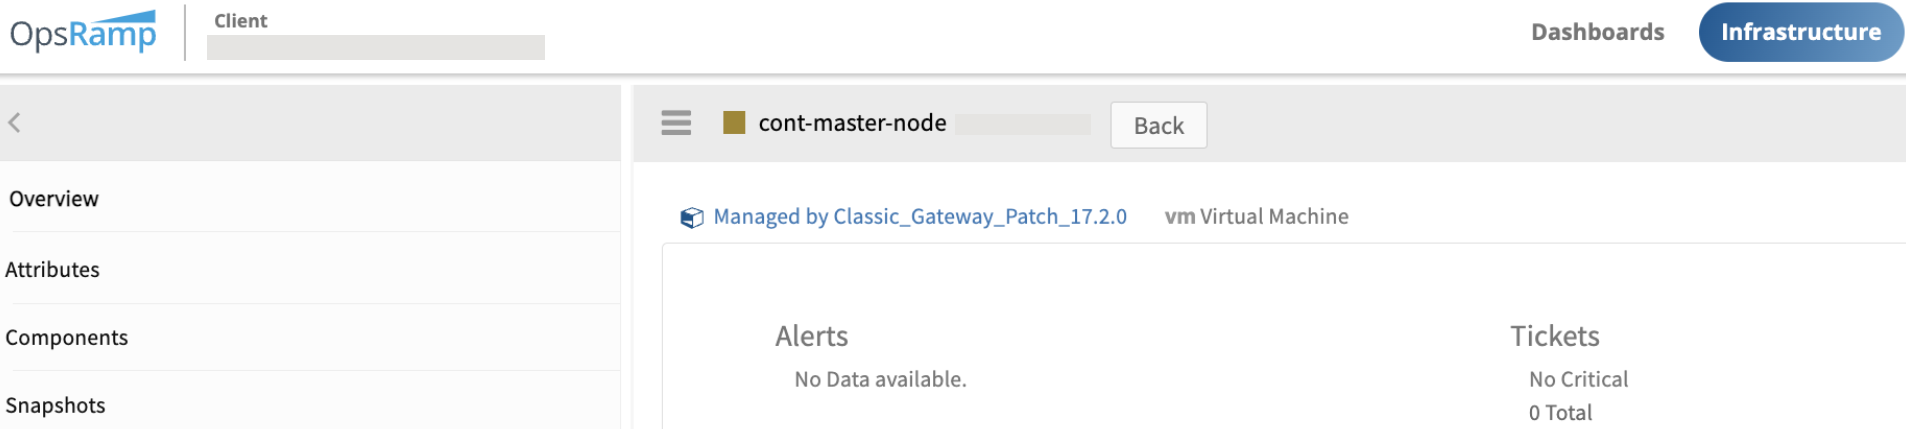
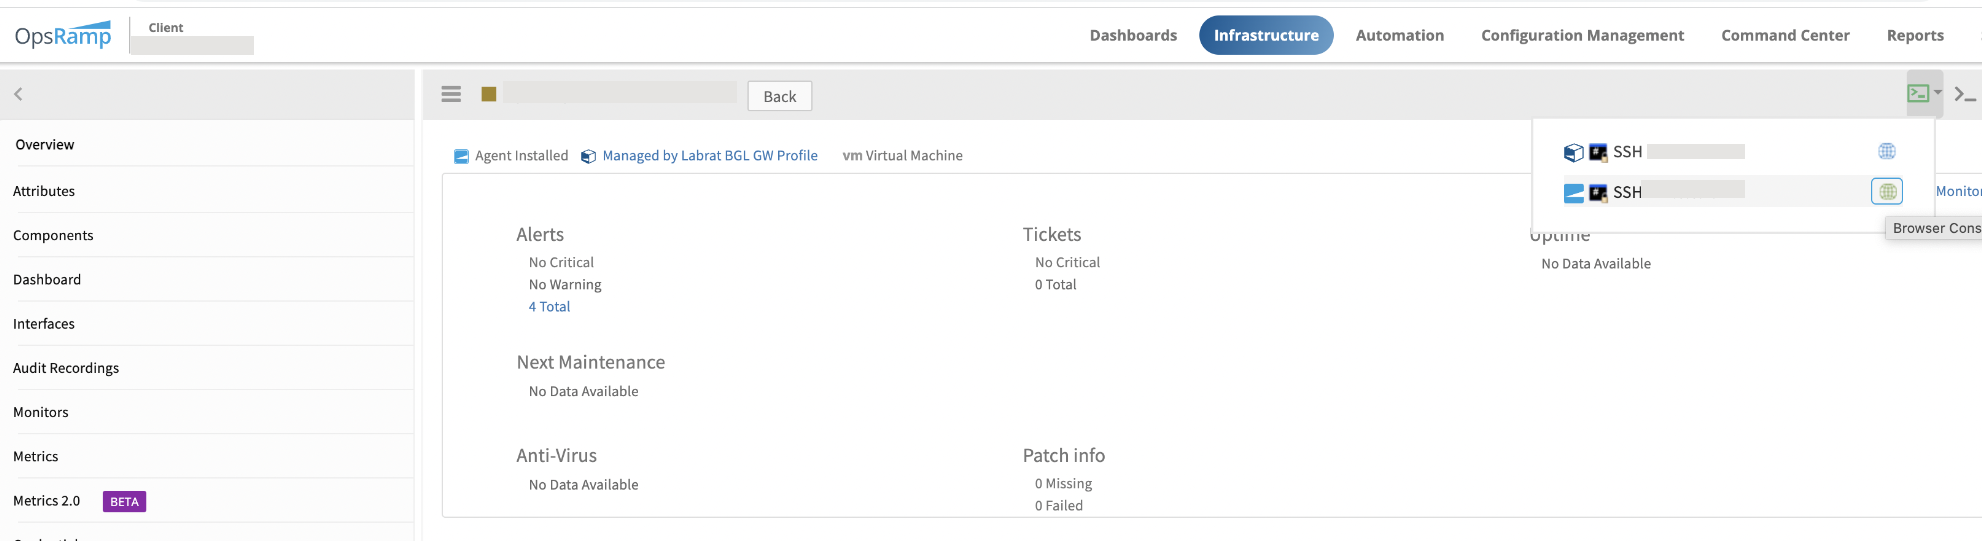
Navigate to the Overview section of the Device (Infrastructure > Resources > Search using IP or Device Name) and on that device, ensure that the Gateway is online (indicated by blue color as shown below).
Review any alerts associated with the template on the Overview page of the Device (or) navigate to Command Center > Alerts page and filter using the specific server name or Ip address. Common alert MetricName is oracledb.auth.error.
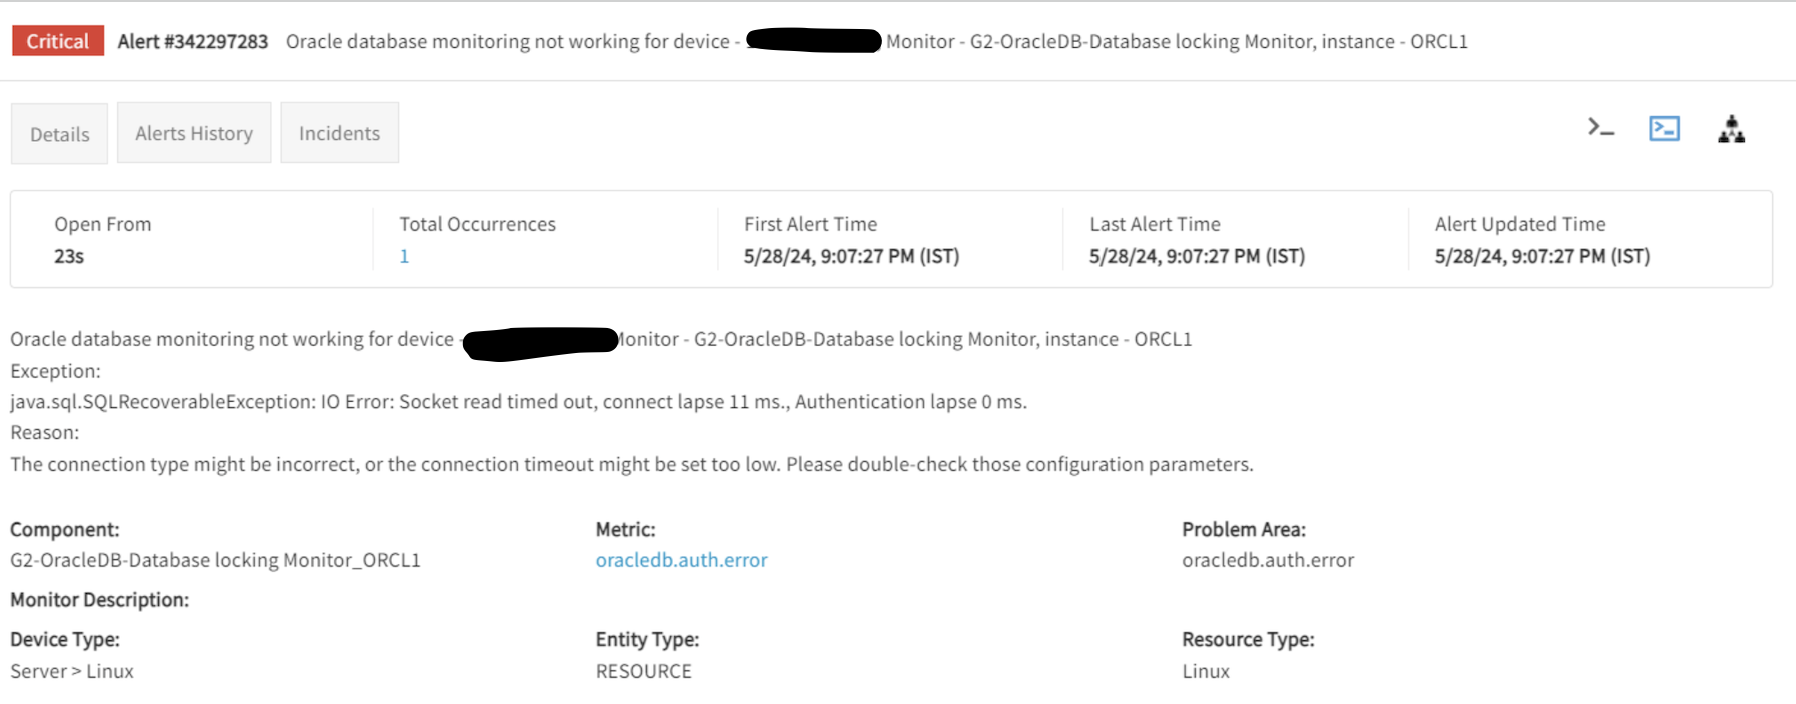
For Gateway version 17.2.0 and above, the component name like <monitorName>_<instanceName> and subject and descriptions are as follows:
Alert subject format – Oracle database monitoring is not working for device - <DeviceName/IpAddress> Monitor – <MonitorName> instance - <InstanceName>
Capture exact errors/exceptions from the target device and place it as Alert Descriptions. Following is a sample alert:
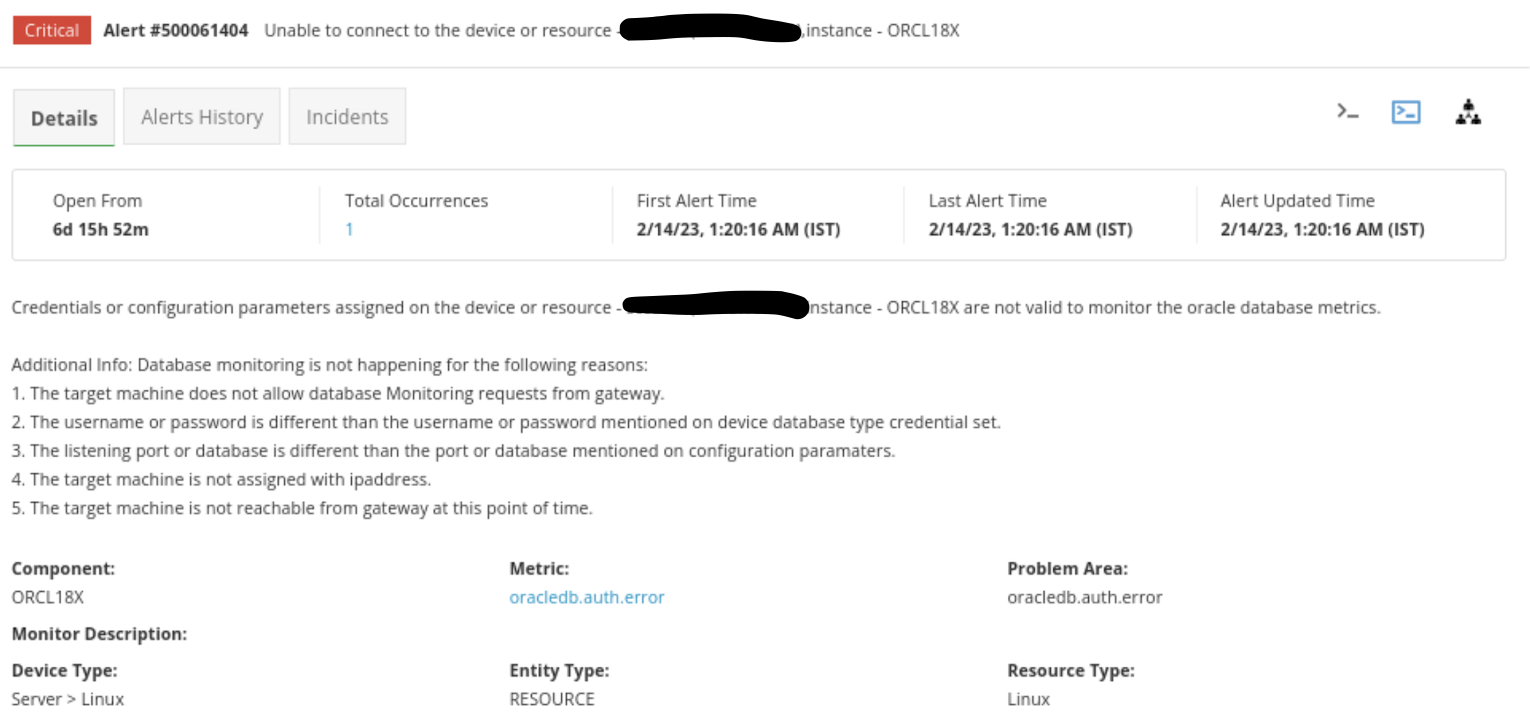
For older Gateway versions, the component name like <instanceName> and static alert format with the MetricName is oracledb.auth.error. Following is a sample alert:
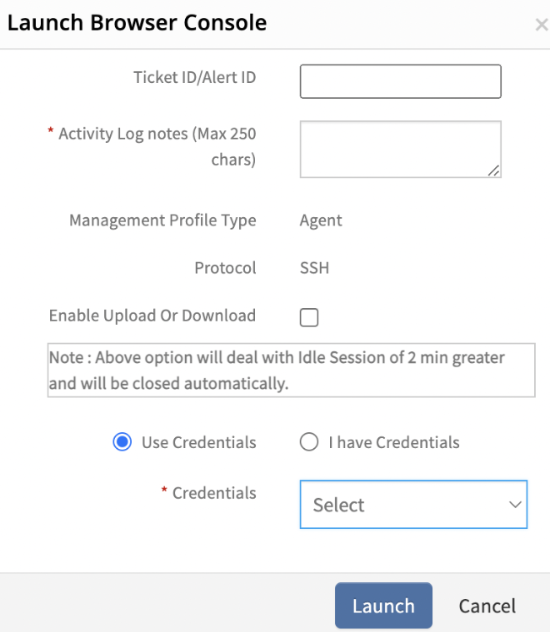
Type gcli and press enter, then gcli terminal will open.
Access Oracle logs. By default, the OpsRamp gateway captures a few error logs. If the user wants to enable all available logs which are related to OracleDB, then follow the below steps:
Access gcli mode by running: gcli
See Step 7: Connect to GCLI terminal in gateway
Use this command to enable debug logs: flag add oracledb.log on 30
Exit gcli prompt and run this command to observe logs: sudo tail -100f /var/log/app/vprobe.log
In NextGen Gateway, if the user wants to copy files from the vProbe container to the gateway cli, execute the following command after exiting the container:
Execute Oracle query manually from the GCLI on the target machine.
Access gcli mode by running: gcli
See Step 7: Connect to GCLI terminal in gateway.
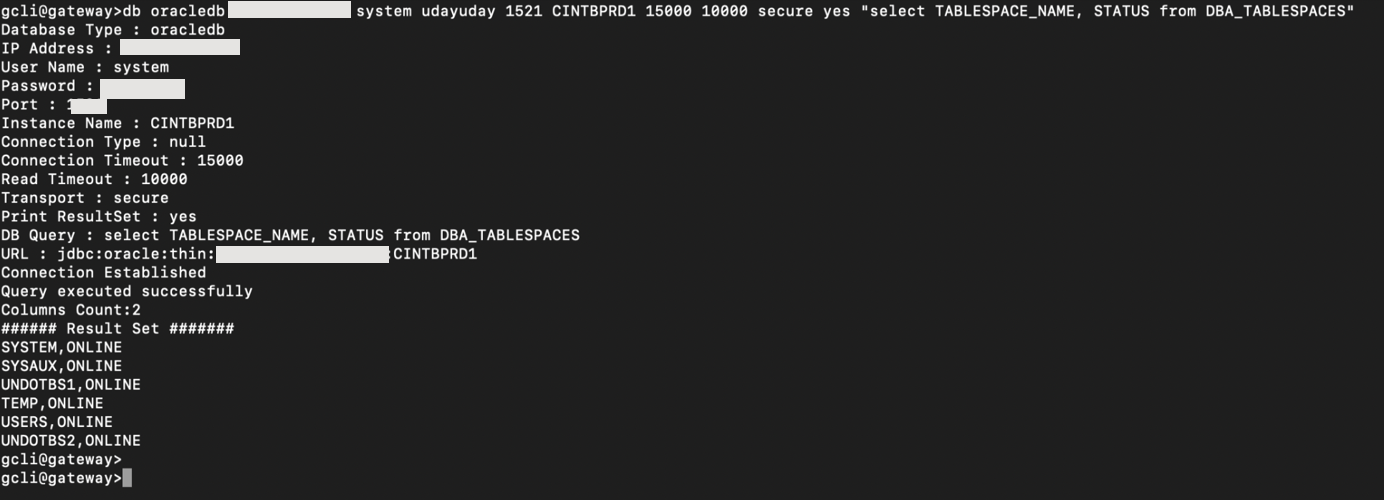
Execute Oracle query via gcli prompt using Oracle SID: Syntax of the command: db oracledb <Ipaddress> <username> <password> <port> <SID> 15000 10000 insecure <Yes/No> <"Query"> Example:
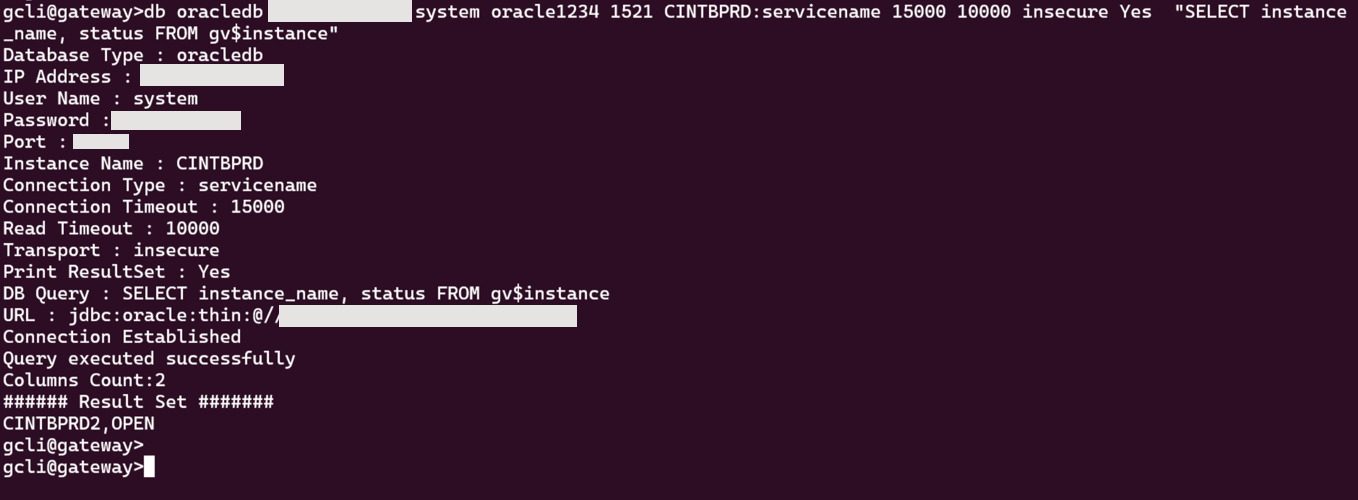
Execute Oracle query via gcli prompt using Oracle ServiceName: Syntax of the command: db oracledb <Ipaddress> <username> <password> <port> <ServiceName>:servicename 15000 10000 insecure <Yes/No> <"Query">
If you are unable to determine the root cause of the issue from the logs or query output, or if different exceptions occur when executing an Oracle query, raise a case and attach the relevant logs and manual query output.
Use case 2 - Graph data is not populating for specific or all metrics
Check if the graph is enabled or not at metric level. If it is enabled, check whether the data fetched from the latest snapshot data is a string.
If it is a string, then check if Enum Mapping is defined for that string at metric level.
If Enum mapping is not defined for that particular string and it is a global template, raise a case while attaching screenshots of latest snapshot data, Enum Mapping defined at Metric.
If Enum mapping is not defined for that particular string and it is a customer-written template, then suggest the customer to edit the metric and add this new state in State Descriptions field as shown in the above screenshot. Also see How to handle enum mappings & Alerting
If you are unable to determine the root cause of the issue after following the above steps, raise a case and attach the relevant logs and manual query output.
Use case 3 - User is observing gaps in metric graphs
This issue might be due to the following reasons:
Gateway going offline at that time
The device is not reachable and port connectivity issues.
There may be no data available for the metric on the device at that time.
Check the debug level logs to cross verify if Gateway was offline at that time.
If you do not find any logs related to those, then raise a case while attaching logs, to analyze query output at those specific times when graph is not populating.
Use case 4 - Alerts are not getting generated on resource for particular metric
Check latest snapshot data to see if any data is being retrieved from device for that metric and also verify the thresholds defined for the metric.
If the latest snapshot data is also not being fetched for that metric, then execute the command or script manually on the device, to see if any data exists for that metric.
Use case 5 - Alerts generated do not align with the defined alert thresholds
Alert thresholds follow a hierarchical order, starting from the component level and moving up to the template level. Each level can override the thresholds set at the previous level. Component-level settings override those set at the device level, and device-level settings take precedence over template-level settings.
This hierarchy ensures that monitoring configurations can be finely tuned at various levels of the system, allowing for granular control over alerting parameters. This approach enables more precise and effective management of alerts tailored to the specific needs of each level.
ORA-12505: This error indicates that the listener received a connection request but could not process it because the service requested by the client is not available or is not properly configured. This could happen if the service name specified in the connection string does not match any service registered with the listener or if the listener configuration is incorrect.
ORA-12514: This error indicates that the listener could not find the requested service or database instance. This could happen if the service name specified in the connection string does not match any service registered with the listener or if the database instance is not started.
ORA-01034: Database Unavailable: The Oracle database instance is not running or is inaccessible, possibly due to a shutdown, startup failures, or network issues.
ORA-12154: The client is unable to resolve the specified service name in the connect string, often due to syntax errors or misconfiguration of the TNSNAMES.ORA file.
ORA-02391: The user has exceeded the maximum number of concurrent sessions allowed per user.
ORA-12170: The client was unable to establish a connection within the specified timeout period, often due to network issues or database overload.
ORA-12547: A communication breakdown between the client and server may be caused by network issues or server process termination.
ORA-12541: The client is unable to establish a connection with the listener process on the server. This could be due to the listener process not running, an incorrect hostname or port, or network issues.
ORA-01017: An incorrect username or password was provided for login.
ORA-28000: The user account is locked, possibly due to multiple failed login attempts or administrator action.
ORA-01005: Attempt to log in without entering a password.
ORA-12638: Failure to retrieve credentials during the authentication process.
ORA-12641: The authentication service fails to initialize properly, often due to misconfiguration or service issues.
ORA-28001: The user’s password has expired according to the password expiration policy set by the database administrator.
ORA-28002: The user’s password is about to expire within the specified number of days, according to the password expiration policy.
ORA-28003: The provided password does not meet the password complexity requirements specified by the password verification function.
ORA-28017: This error specifically relates to the SYS user account. It occurs when the provided password for the SYS user is incorrect.
ORA-12545: This indicates a networking issue where the host or IP address specified for the Oracle database instance is unreachable or incorrect.
Note
These exceptions may occur while manually executing the Oracle query via Gateway GCLI prompt. To resolve these type of issues, try the following solutions:
Check whether the Oracle database instance with the specified SID is up and running.
Ensure that the listener is properly configured to recognize the SID by checking the listener.ora file.
Verify that the connection descriptor contains the correct and complete SID value.
Ensure that the client machine (Gateway) has the necessary privileges and is authorized to access the specified database instance.
Try restarting the listener service or the Oracle database instance to see if that resolves the issue.
Where can I check OpsRamp Supported Oracle Metrics?
Check the Recommended Templates page within the public documentation. See OracleDB.
If the required monitoring support is not found on these pages and it is a generic request applicable beyond the customer’s specific needs, only then submit a case to support team for Request for Enhancement (RFE).
However, if the monitoring requirement is specific to the customer’s needs, customers need to develop their own script by following this documentation.
How can I identify whether a template is Global or Customer written?
The details available in the link below only pertain to Global Templates and Metrics. OracleDB Metrics
Why is not the template getting the latest metric snapshot date?
What steps should a user follow if they want to create their own query-based custom metric for database monitoring?
Users can refer to the Create Custom Metrics guide available in the public documentation. This guide provides comprehensive instructions on how to develop query-based custom metrics.
The above documentation is for query based Oracle monitoring. Similarly, if they want to create custom metrics for PostgreSQL, MySQL, or MSSQL, customers should select the corresponding Application type (PostgreSQL, MySQL, or MSSQL) during the metric creation process.
Can customer create query based metrics using Agent collector type?
No, Query-based metrics only work with collector type Gateway, not with Agent.
How to plot graph for string values, like health or status metrics?
How can I exclude monitoring for some components of metric?
If the user wants to exclude monitoring some components of metric, then they can use the Component Filters option of RSE.
By using these component filters, you can monitor specific components or ignore unwanted components from monitoring.
For more information, refer to Component Filters.
For Oracle monitoring, should SSH credentials be assigned on the target device or on the Gateway device?
In Oracle monitoring, no need to assign the SSH login credentials on the target device, not on the Gateway device.
What are the authentication error alerts (Database Related) observed on device Overview page?
If it is Oracle query-based template, make sure that Oracle Database Type credentials are assigned in device’s credentials tab.
What are Oracle Query execution errors on device, like permissions error?
Assigned Database Type credentials must have sufficient permissions to execute the query on the device. Refer - Points to be considered.
How can I find the queries used in the template?
Go to the Setup page and navigate to Monitoring. Click on Metrics. Search the exact metric based on scope, then open the metric definition. The monitoring query is available on the metric definition.
Can a user assign version 1 and version 2, 3, 4, etc. of a template on the same device?
No, user cannot assign version 1 and version 2, 3, 4, etc., of a template to the same device simultaneously. In nearly all cases, the metrics present in version 1 (v1) will also be included in version 2 (v2) or later versions. The later versions typically include additional metrics, enhancements to existing metrics or methodologies, and bug fixes. Therefore, we recommend always using the latest version of the template to ensure that users benefit from these improvements and new features.
Supported Templates
Collector Type
Template Name
Gateway
G2-OracleDB-Database Monitoring
G2-OracleDB-Database backups
G2-OracleDB-Database scheduled jobs
G2-OracleDB-Database locking
G2-OracleDB-ASM Availability
G2-OracleDB-Database Space Usage
G2-OracleDB-ARCHIVER
G2-OracleDB-Password Security
G2-OracleDB-Alert Log Status
G2-OracleDB-Listener SID Availability
G2-OracleDB-Monitored License Used Status
G2-OracleDB-Database Resource Usage
G2-OracleDB-Listener
G2-OracleDB-DataGuard
G2-OracleDB-Sessions - v3.0
G2-OracleDB-Oracle Library Stats - v2.0
G2-OracleDB-Oracle Memory - v2.0
G2-OracleDB-Performance - v2.0
G2-OracleDB-Sessions - v2.0
G2-OracleDB-System Stats - v2.0
G2-OracleDB-System Summary - v2.0
G2-OracleDB-Table Space - v2.0 - v2.0
Supported Metrics
Metric
Metric Display Name
Unit
Description
Oracle_asm_alertlog_size
Oracle ASM AlertLog Size
megabytes(MB)
This metric monitors the disk used space (in MB) by ASM alert log
Oracle_database_archivelog_total_usage
Oracle Database Archive Log Total Usage
Gigabytes(GB)
This metric monitors the total size (in GB) of Archive log
Oracle_database_archfile_usage
Oracle Database ArchFile Usage
Megabytes(MB)
This metric monitors the size (in MB) of each Arch file
Oracle_database_datafile_availability
Oracle Database Datafile Availability
This metric monitors the datafile availability. Below are the possible values: 1 - AVAILABLE 2 - INVALID
Oracle_database_invalid_objects
Oracle Database Invalid Objects
This metric displays invalid objects available or not
Oracle_database_locked_critical_users
Oracle Database Locked Critical Users
This metric monitors the locked critical users information
Oracle_database_backup_mode
Oracle Database Backup Mode
This metric monitors the oracle database backup mode like Active or InActive
Oracle_database_archivegap_detection
Oracle Database Archive Gap Detection
This metric monitors the Archive GAP detection
Oracle_asm_diskgroup_type
Oracle ASM Disk Group Type
This metric displays the type of the ASM disk group
Oracle_asm_disk_mode_status
Oracle Database Restore Point Guarantee Flashback Status
Monitors the Oracle DB backup restore point Guarantee Flashback DB Status. Below are the possible values: YES - 1 NO - 0
Oracle_database_daysSinceLastRestorePoint
Oracle Database Days Since Last Restore Point
Days
Monitors the age (In Days) of last successful restore point
Oracle Database Restore Point Guarantee Flashback Status
Monitors the Oracle DB backup restore point Guarantee Flashback DB Status. Below are the possible values: YES - 1 NO - 0
oracle_database_daysSinceLastRestorePoint
Oracle Database Days Since Last Restore Point
Days
Monitors the age (In Days) of last successful restore point
Oracle_database_blockCorruption_count
Oracle Database Block Corruption Count
Count
Monitors the count of block corruption in Oracle DB
Oracle_database_blockCorruption_type
Oracle Database Block Corruption Type
Monitor the type of block corruption in Oracle DB
Oracle_database_undoUnexpired_count
Oracle Database Undo Unexpired Count
Count
Monitors the count of Undo Unexpired in Oracle DB
Oracle_database_indexLogging_count
Oracle Database Index Logging Count
Count
Monitors the count of Index logging in Oracle DB
Oracle_database_licenseOptionUsage_status
Oracle Database License Option Usage Status
Monitors the Oracle DB License Option Usage Status: Below are the possible values: YES - 1 NO - 0
Oracle_database_redoLog_status
Oracle Database RedoLog Status
Monitors the status of each redo log. Below are the possible values: FileInUse (File is in use) - 0 INVALID (File is inaccessible) - 1 STALE (File's contents are incomplete) - 2 DELETED (File is no longer used) - 3
Oracle_database_backup_archive
Monitors the status of the Oracle Database Archive Backup DaysAgo
Oracle Database Archive Backup DaysAgo
Days
Oracle_database_backup_full
Monitors the status of the Oracle Database Full Backup DaysAgo
Oracle Database Archive Backup DaysAgo
Days
Oracle_database_backup_usermanaged
Monitors the status of the Oracle Database User Managed Backup DaysAgo
Oracle Database User Managed Backup DaysAgo
Days
Oracle_database_backup_incremental
Monitors the status of the Oracle Database Incremental Backup DaysAgo
Oracle Database Incremental Backup DaysAgo
Days
Oracle_database_backup_rman
Monitors the status of the Oracle Database RMAN Backup DaysAgo
Oracle Database RMAN Backup DaysAgo
Days
Oracle_database_scheduler_jobs_status
Monitors the status of the Oracle Database Scheduler Jobs Status
Oracle Database Scheduler Jobs Status
Oracle_database_dbmsjobs_failure_count
Monitors the status of the Oracle Database DBMS Jobs Failure Count
Oracle Database DBMS Jobs Failure Count
Count
Oracle_database_autotask_job_status
Monitors the status of the Oracle Database AutoTask Job Status
Oracle Database AutoTask Job Status
Oracle_database_lockedusers_status
Monitors the status of the Oracle Database Locked Users Status
Oracle Database Locked Users Status
Oracle_blocking_session_count
Monitors the status of the Oracle Blocking Session Count
Oracle Blocking Session Count
Count
Oracle_asm_disk_status
Monitors the status of the Oracle ASM Disk Status
Oracle ASM Disk Status
Oracle_asm_diskgroup_status
Monitors the status of the Oracle ASM DiskGroup Status
Oracle ASM DiskGroup Status
Oracle_asm_acfs_status
Monitors the Oracle ASM ACFS Status
Oracle ASM ACFS Status
Oracle_asm_diskgroup_utilization
Monitors the status of the Oracle ASM DiskGroup Space Utilization
Oracle ASM DiskGroup Space Utilization
%
Oracle_asm_diskgroup_utilization
Monitors the status of the Oracle ASM DiskGroup Space Utilization
Oracle ASM DiskGroup Space Utilization
%
Oracle_database_required_mirror_freespace
Monitors the status of the Oracle Database Including different redundancy requirements (Safely usable data usage)
Oracle Database Required Mirror Free Space
MB
Oracle_database_safelyusable_diskspace
Monitors the status of the Oracle Database Including safely usable disk space on different redundancy (Safely usable data usage)
Oracle Database Safely Usable Disk Space
MB
Oracle_database_tablespace_usedPercent
Monitor the Oracle table space used percent
Oracle Database Tablespace Used Percent
%
Oracle_database_flash_recovery_usage
Flash recovery usage (in MB) of the oracle database
Oracle Database Flash Recovery Usage
MB
Oracle_database_flashback_log_usage
FlashBack Log usage in percent
Oracle Database FlashBack Log Usage
%
Oracle_database_flashback_log_usage
FlashBack Log usage in percent
Oracle Database FlashBack Log Usage
%
Oracle_database_recoveryDest_used_percentage
Oracle Database Recovery Destination usage in Percent
Monitors the archive log mode of the instance. Below are the possible values: 0 - NOARCHIVELOG 1 - ARCHIVELOG 2 - MANUAL
Oracle Database Archive Log Mode
Oracle_database_password_expiry_Days
Monitors the users password expiry in days
Oracle Database Password Expiry Days
Days
Oracle_database_users_default_password
Monitors the count of users which are using default password
Oracle Database Users Default Password
Count
Oracle_database_alertLog_availability
Monitors the alert log availability of given instances. Below are the possible values: 0 - Not Available 1 - Available
Oracle Database Alert Log Availability
Oracle_database_alertLog_writeAccessibility
Monitors the alert log write accessibility of given instances. Below are the possible values: 0 - Not Accessible 1 - Accessible
Oracle Database Alert Log Write Accessibility
Oracle_database_alertLog_readAccessibility
Monitors the alert log read accessibility of given instances. Below are the possible values: 0 - Not Accessible 1 - Accessible
Oracle Database Alert Log Read Accessibility
Oracle_database_listenerSID_availability
Monitors the oracle database listener SID availability status: Below are the possible values: 1 - Available 0 - Unavailable
Oracle Database Listener SID Availability
Oracle_database_monitoredLicense_Usedstatus
It provides an oracle monitored license list with currently used status. Below are the possible values: TRUE: 0 FALSE: 1
Oracle Database Monitored License Used Status
Oracle_database_resource_process_limit
Oracle Database Resource Process Limit
Oracle Database Resource Process Limit
Count
Oracle_database_resource_session_limit
Oracle Database Resource Session Limit
Oracle Database Resource Session Limit
Count
Oracle_database_listener_service_status
Oracle Database Listener Service Status
Oracle Database Listener Service Status
Oracle_database_local_listener_status
Oracle Database Local Listener Status
Oracle Database Local Listener Status
Oracle_database_all_listener_status
Oracle Database All Listener Status
Oracle Database All Listener Status
Oracle_database_listener_status_with_nodes
Oracle Database Listener Status With Nodes
Oracle Database Listener Status With Nodes
Oracle_database_scan_listener_status
Oracle Database Scan Listener Status
Oracle Database Scan Listener Status
Oracle_database_listener_availability
Oracle Database Listener Availability
Oracle Database Listener Availability
Oracle_dg_database_role_change_withDGB
Oracle DataGuard DB Role Change with DataGuard Broker
Oracle DataGuard DB Role Change with DataGuard Broker
Oracle.session.limit.usage
It monitors the sessions utilization.
Session Limit Usage
%
Oracle.inactive.sessions
It monitors the inactive sessions
Inactive Sessions
Count
Oracle.active.sessions
It monitors the active sessions
Active Sessions
Count
Oracle_session_waits_perEvent
Monitors the sum of "session waits" per each event and class (event for which sessions have just completed waiting or are currently waiting)
Oracle Session Waits PerEvent
S
Oracle_system_waits_perClass
Monitor oracle system class waits (The system-level waits represent a high level summary of all session-level waits). This metric evaluated using this formula avg of waits = sum(time_waited)/sum(total_waits).
Oracle System Waits PerClass
S
Oracle_database_avgGlobalLockGetTime
It monitors the average global lock get time (in milliseconds)
Oracle Database Average Global Lock Get Time
Milliseconds
Oracle_database_bufferCachehitRatio
It monitors the buffer cache hit ratio.
Oracle Database Buffer Cache Hit Ratio
%
Oracle_database_chainedRows
It monitors the count of chained rows from all available tables in oracle database
Oracle Database Chained Rows
Count
Oracle_database_dictionaryCacheHitRatio
It monitors the Dictionary cache hit ratio
Oracle Database Dictionary Cache Hit Ratio
%
Oracle_database_gc_blocks_corrupt
It monitors the value of the global cache blocks corrupt
Oracle Database Global Cache Blocks Corrupt
Count
Oracle_database_gc_blocks_lost
It monitors the value of the global cache blocks lost
Oracle Database Global Cache Blocks Lost
Oracle_database_gc_cr_timeouts
It monitors the value of global cache consistent read timeouts. This statistic is available in older oracle versions only.
Oracle Database Global Cache Consistent Read Timeouts
Oracle_database_gc_convert_timeouts
It monitors the value of global cache convert timeouts, This statistic is available in older oracle versions only.
Oracle Database Global Cache Convert Timeouts
Oracle_database_gc_service_utilization
It monitors the value of global cache service utilization, This statistic is available in older oracle versions only.
Oracle Database Global Cache Service Utilization
%
Oracle_database_unUsable_index_count
It monitors the count of the unusable indexes in the oracle database.
Oracle Database UnUsable Index Count
Count
Oracle_database_cacheFusionWrites
It monitors the ratio of cache fusion writes
Oracle Database Cache Fusion Writes Ratio
%
Oracle_database_redoLog_contention
It monitors the miss ratio for redo log latches. If the ratio of MISSES to GETS exceeds 1% then there is latch contention.
Oracle Database Redo Log Contention
%
oracle_database_memory_sortRatio
Monitors the ratio of memory sorts
Oracle Database Memory Sort Ratio
%
Oracle_database_concurrentUsers
Monitors the count of concurrent users
Oracle Database Concurrent Users
Count
Oracle_database_overallSize
Monitors the oracle database size (in MB) based on data files, temp files, log files and the control files
Oracle Database Overall Size
MB
Oracle_database_size_withDataAndLogFiles
Monitors the oracle database size (in MB) based on log and data files.
Oracle Database Size With Data And Log Files
MB
Oracle_database_locked_users_count
Monitors the number of users suspended by locks within a timeout
Oracle Database Locked Users
Count
Oracle_database_resource_utilization
Monitors the resource utilization for the resources: Processes, Sessions and Transactions
Oracle Database Resource Utilization
%
Oracle_database_pga_memory_usage
Monitors the PGA memory usage (in Bytes) of the each oracle user
Oracle Database PGA Memory Usage
Bytes
Oracle_database_activeConnectionRatio
Monitors the ratio of oracle active connections
Oracle Database Active Connection Ratio
%
Oracle_database_activeUsers
Monitors the count of oracle active users
Oracle Database Active Users
Count
Oracle_database_remaining_extents
Monitors the count of remaining extents for each tablespace in the oracle
Oracle Database Remaining Extents
Count
Oracle_database_rollbackSegments
Monitors the value of a sufficient number of rollback segments.
Oracle Database Rollback Segments
Oracle_database_tablespace_freeSpace
Monitors the free space utilization of each tablespace in oracle.
Oracle Database Tablespace FreeSpace
%
Oracle_database_tablespace_status
Monitors the status of each tablespace in oracle. Below are the possible values: ONLINE OFFLINE READ ONLY
Oracle Database Tablespace Status
Oracle_database_tablespace_deficit_status
It monitors the deficit status of each tablespace in oracle. Below are the possible values: 0 - Tablespace has deficit (i.e. available space < next extent) 1 - Tablespace has no deficit (i.e. available space > next extent)"
Oracle Database Tablespace Deficit Status
Enum Mapping
Oracle_database_tablespace_size
It monitors the size(in MB) of the each tablespace (including temp tablespace)
Oracle Database Tablespace Size
MB
Oracle_database_tablespace_temp_free
Monitors the free space (in Bytes) of the temp tablespace
Oracle Database Tablespace Temp Free
Bytes
Oracle_database_no_next_extents
Monitors the count of database segments which are having no next extent
Oracle Database No Next Extents
Oracle_asm_acfs_status
Monitors the Oracle ASM ACFS status.
Oracle ASM ACFS Status
oracle_asm_alertlog_size
Oracle ASM AlertLog Size
megabytes(MB)
oracle_asm_disk_status
Monitors the Oracle ASM disk status.
Oracle ASM Disk Status
oracle_asm_diskgroup_status
Monitors the Oracle ASM disk group status.
Oracle ASM DiskGroup Status
oracle_asm_diskgroup_utilization
Monitors the Oracle ASM disk group space utilization.
Oracle ASM Disk Group Space Utilization
percentage(%)
oracle_asm_failure_groups_status
Monitors the Oracle ASM failure groups status.
Oracle ASM Failure Groups Status
oracle_blocking_session_count
Monitors the Oracle blocking session count.
Oracle Blocking Session Count
count
oracle_database_alertLog_availability
Oracle Database Alert Log Availability
N/A
oracle_database_alertLog_readAccessibility
Oracle Database Alert Log Read Accessibility
N/A
oracle_database_alertLog_writeAccessibility
Oracle Database Alert Log Write Accessibility
N/A
oracle_database_archivegap_detection
Oracle Database Archive Gap Detection
N/A
oracle_database_archivelog_total_usage
Oracle Database Archive Log Total Usage
GB
oracle_database_archiveLogMode
Oracle Database Archive Log Mode
N/A
oracle_database_autotask_job_status
Monitors the Oracle database auto task job status.
Oracle Database AutoTask Job Status
oracle_database_backup_full
Monitors the Oracle database full backup days ago.
Oracle Database Full Backup DaysAgo
Days
oracle_database_backup_incremental
Monitors the Oracle database incremental backup days ago.
Oracle Database Incremental Backup DaysAgo
Days
oracle_database_backup_mode
Oracle Database Backup Mode
N/A
oracle_database_backup_rman
Monitors the Oracle database RMAN backup days ago.
Oracle Database RMAN Backup DaysAgo
Days
oracle_database_backup_usermanaged
Monitors the Oracle database user managed backup days ago.
Oracle Database User Managed Backup DaysAgo
Days
oracle_database_blockCorruption_count
Oracle Database Block Corruption Count
count
oracle_database_blockCorruption_type
Oracle Database Block Corruption Type
N/A
oracle_database_component_status
Oracle Database Component Status
N/A
oracle_database_daysSinceLastRestorePoint
Oracle Database Days Since Last Restore Point
Days
oracle_database_dbmsjobs_failure_count
Monitors the Oracle database DBMS jobs failure count.
Monitors the Oracle database tablespace usage without autoextend.
Oracle Database Tablespace Usage Without AutoExtend
percentage(%)
oracle_database_tablespace_usedPercent
G2-OracleDB-Database Space Usage Monitor
G2-OracleDB-Database Space Usage
percentage(%)
oracle_database_undoUnexpired_count
Oracle Database Undo Unexpired Count
count
oracle_database_users_default_password
Oracle Database Users Default Password
count
oracle.active.sessions
Monitors the active sessions.
Active Sessions
Count
oracle.asm.archive.pct
Oracle query for ASM ARCHIVE diskgroup.
Oracle ASM Archive pct
Percentage(%)
oracle.asm.data.pct
Oracle query for ASM DATA diskgroup.
Oracle ASM Data pct
Percentage(%)
oracle.blocking.lock.queries
Validates the number of block lock queries on a specific database.
Oracle Blocking Lock Queries
Count
oracle.blocking.session
To monitor blocked valid sessions.
Oracle Blocking Session
Count
oracle.BufferCacheHitRatio.pct
To monitor buffer cache hit ratio value in percentage.
Oracle BufferCacheHitRatio pct
Percentage(%)
oracle.cache.blocks.lost
The number of global cache blocks lost over the user-defined observation period.
Cache Blocks Lost
Count
oracle.cache.invalidations
Validates the number of cache invalidations on a specific database.
Oracle Cache Invalidations
Count
oracle.check.db.alive
Monitors database instance connectivity.
Check Db Alive
oracle.cpu.usage.per.sec
The CPU usage per second by the database processes measured in hundredths of a second.
CPU Usage Per Sec
Per Second(psec)
oracle.cpu.usage.per.txn
The amount of CPU usage per transaction for a specific task or session.
CPU Usage Per Txn
Percentage(%)
oracle.database.cpu.time.ratio
The Database CPU Time Ratio is calculated by dividing the amount of used CPU in the database by the amount of total database time. Total database time is the time spent by the database on user-level calls .
Database CPU Time Ratio
Percentage(%)
oracle.database.wait.time.ratio
Monitors the database wait time ratio.
Database Wait Time Ratio
Percentage(%)
oracle.db.instance.uptime
The db instance uptime since start up.
DB Instance Uptime
Days
oracle.disk.sort.ratio.pct
To monitor disk sort ratio value in percentage.
Oracle Disk Sort Ratio pct
Percentage(%)
oracle.duplicated.filename.count
To check the existence of duplicated db filenames in different ASM paths.
Oracle Duplicated Filename Count
Count
oracle.executions.per.sec
The average transactions per second
Executions Per Sec
Per Second(psec)
oracle.executions.per.txn
The average amount of time per execution
Executions Per Txn
oracle.failed.logon.count
Monitors the failed logon attempts of the current user.
Failed Logon Count
Count
oracle.inactive.sessions
Monitors the inactive sessions.
Inactive Sessions
Count
oracle.invalid.objects
Checks for invalid objects in a database.
Invalid Objects
Count
oracle.io.wait.time
The total time taken to complete the I/O operations keeping the application in a blocked state.
IO Wait Time
Milli Seconds(ms)
oracle.java.pool.free
Monitors the free java pool memory in MB.
Java Pool Free
Mega Bytes(MB)
oracle.large.pool.free
Monitors the free large pool memory in MB.
Large Pool Free
Mega Bytes(MB)
oracle.library.cache.gets
Validates the number of library cache gets by the database.
Oracle Library Cache Gets
Count
oracle.library.cachereloads
Validates the number of library cache reloads by the database.
Library Cache Reloads
oracle.librarycachehitratio.pct
To monitor the library cache hit ratio value in percentage.
Oracle Library Cache Hit Ratio pct
Percentage(%)
oracle.logons.per.sec
The number of logons per second during the sample period.
Logons Per Sec
Count
oracle.long.running.queries
Validates the number of long running queries on a specific database.
Oracle Long Running Queries
Count
oracle.maxdbfilepct.usage
To monitor the percentage of open oracle files.
Oracle Max DB File pct usage
Percentage(%)
oracle.maxopencursor.username.count
To monitor maximum open cursor value for each db username.
Oracle Max Open Cursor Username Count
Count
oracle.process.count
Monitor the current processes running in the database.
Process Count
oracle.procsused.pct
To monitor db process usage in percentage.
Oracle Processes Used pct
Percentage(%)
oracle.rac.tablespace.space.used
To monitor top(20) RAC tablespace space usage where percentage > 85%.
Oracle RAC Tablespace Space Used Top 20 Greaterthan 85
Percentage(%)
oracle.redo.log.space.requests
The number of requests per second by Oracle waiting for disk space allocation for the redo log entries.
Redo Log Space Requests
Req per Sec
oracle.redolog.switch.count
To monitor the number of redolog switch.
Oracle Redolog Switch Count
Count
oracle.sequence.pctused
To monitor the sequence usage in percentage.
Oracle Sequence Pct Used
Percentage(%)
oracle.session.cpu_used
Monitors the session cpu usage in seconds.
Session Cpu Used
Seconds(s)
Version History
Gateway Version
Enhancements
21.2.0
Enhanced Oracle database monitoring to support mapping specific credentials to individual database instances within a monitor. This ensures each Oracle DB instance authenticates with the correct credential on the first attempt, preventing unnecessary failed logins and avoid account lockout issues in multi-instance Oracle environments.Note: Mapped credentials must be assigned on the server.